Chapter 13. Monitoring Operations
This chapter details how to monitor and control the CMG-EAM. Some functionality is only available from the command line (when connected via a serial cable or via SSH over the network - see section 2 for details on how to do this) and other features are only available via the web interface. This chapter will describe both.
13.1 Diagnostics and the Summary menu
13.1.1 System Status
To view the overall system status, simply go to the front page of the web interface (or choose the “System status” link in the left-hand frame within the “Summary” box).
One box is displayed per port or major subsystem. Boxes are colour-coded and may be displayed in red (bad), green (good) or white (no information).
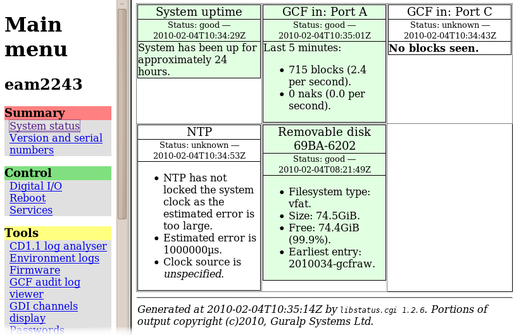
Red boxes indicate that some part of the system is malfunctioning, and require further investigation. Malfunctions could occur due to hardware failure but the most likely explanation is an incorrect configuration setting.
From the command line interface, you can view the same information by running libstatus-query:
eam999 ~ # libstatus-query
================================================================
2008-05-01T13:57:52Z: Good : System uptime
----------------------------------------------------------------
System has been up for approximately 4 days.
================================================================
2008-05-01T13:59:16Z: Unknown : GCF in: Port A
----------------------------------------------------------------
No blocks seen.
================================================================
2008-05-01T13:59:17Z: Good : GCF in: Port F
----------------------------------------------------------------
Last 5 minutes:
* 1532 blocks (5.1 per second).
* 0 naks (0.0 naks per second).
================================================================
2008-05-01T13:59:14Z: Good : NTP
----------------------------------------------------------------
NTP has locked the system clock.
Clock source is UDP/NTP.
================================================================
2008-05-01T13:44:11Z: Good : Removable disk 0000-0401
----------------------------------------------------------------
Filesystem type: vfat.
Size: 37.2GiB.
Free: 24.9GiB (66.9%).
Earliest entry: 2008091-gcfraw.
13.1.2 System Log
The most important source of diagnostic and debugging information is the system log facility (“syslog”). This logs all messages from programs and from the Linux kernel. At present, this can only be viewed from the command line.
To view the system logs, you can use the tail, less, grep or vi commands to inspect the file /var/log/messages - older files are available as /var/log/messages.1, /var/log/messages.2 etc.
Use the following syntax to view the files:
tail /var/log/messages
Views the last few entries.tail -f /var/log/messages
As above but, after printing the last ten lines of the file, continues to run, printing each new line as it is added to the log. Type +
+ to stop the output and return to the command line.
less /var/log/messages
Views the whole log file; use the ,
,  ,
,  and
and  keys to navigate and the
  key to exit.
vi /var/log/messages
Those users familiar with the vi text editor may wish to use it as the most powerful way to view log entries.grep -i 'string' /var/log/messages
Searches for a string or pattern in the log file. This search is case insensitive (-i flag).
grep is a very powerful tool for searching for patterns. For more information, see the section on Regular Expressions in the grep manual page at http://man-wiki.net/index.php/1:grep
13.1.3 Incoming Data
The status web-page has one box for each GCF acquisition process. This box will be updated every minute to reflect the number of packets that have been acquired.
To view details of incoming GCF format data using the command line, use one of the following commands:
gdi-dump -l
Displays a list of channels and segments. For more information, see “GDI Channels Display” in section 13.3.3;gdi-dump -lm
Displays the the same data, along with meta-data added by the relevant input module; orgdi-dump
Displays real-time information about each packet arriving, until interrupted by the operator typing+ .
13.1.4 Version and Serial Numbers
The “Version and serial numbers” item on the “Summary” menu displays information which may be useful for your own records or when requesting technical support. See section 4.1 for more details.
13.2 The Control Menu
The “Control” menu of the web interface is a dynamic menu with content that changes depending on the attached devices. Two items on this menu are always present: “Reboot” and “Services”. CMG-NAM units fitted with RAID arrays will also have a “RAID array services” menu item. Other items will appear as required, depending on both the underlying hardware and attached devices.
13.2.1 Digital I/O (p ower control and anti-tamper monitoring)
The CMG-EAM mk4 hardware can be fitted with optional sensors to monitor the voltages and currents being supplied to the CMG-EAM and also to devices connected to the CMG-EAM ports, such as digitisers. A program on the CMG-EAM runs constantly in the background and monitors the sensors if they are fitted. The same program can monitor the anti-tampering lines, where fitted.
The “Digital I/O” item on the “Control” menu brings up the following screen, (the contents of which may vary with your hardware configuration):

The top if this table on this page shows the real-time voltage, current and power for each monitored line, including each sensor-equipped port of the system. There are also buttons to turn the power to the port on and off.
Clicking the “View details/settings” button produces the following screen (shown here in parts):

The first part of the page duplicates the information shown on the main screen. The remainder of the page provides a more detailed report:
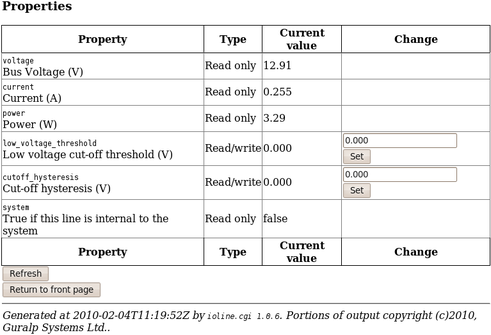
It is possible to protect attached devices from under-voltages by setting a Low voltage cut-off threshold value. If the monitored voltage falls below this value, it is automatically turned off. To prevent rapid, repeated power-cycling of attached devices, a hysteresis value should be set. The monitored voltage must rise above the sum of the threshold voltage and the hysteresis voltage before the supply will be re-enabled.
Click the “Return to front page” button to display the main Digital I/O summary again.
Below the port power monitors, the summary screen displays the anti-tamper lines (when these are fitted):

The detail screen for the tamper detection items display no useful information beyond that displayed on the summary screen.
13.2.2 Digitiser/Sensor Control
The CMG-EAM allows control of attached digitisers and sensors via the web interface or the command line. To configure digitisers, see section 7.
The web interface is simpler and requires no detailed knowledge of the attached devices. The command line interface is more powerful but requires detailed knowledge of the digitiser's command line interface and the manual for the digitiser in question should be referred to for further details.
13.2.2.1 Digitiser/Sensor Control - Web interface
The main menu of the web interface adapts to include additional options when the system detects attached digitisers and/or digital sensors.
Extra items in the “Control” menu are associated with digitiser serial numbers. If a digitiser has two sensors attached to it, it is recommended that an extra serial number be added to the digitiser. See the relevant digitiser manual for information on how to configure this.
The menu items look like this:
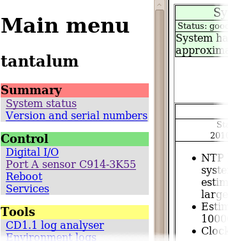
In this illustration, the entry
Port A sensor C914-3K55
indicates the physical connection (Port A) to the attached device, the device type (sensor) and its serial number (C194-3K55). If the instrument is connected via TCP, the EAM connection is shown as host:port.
Selecting one of these menu items takes you to the “Digitiser Control” page. From here, one can query mass positions, lock, unlock and centre the sensor masses and perform calibration functions.
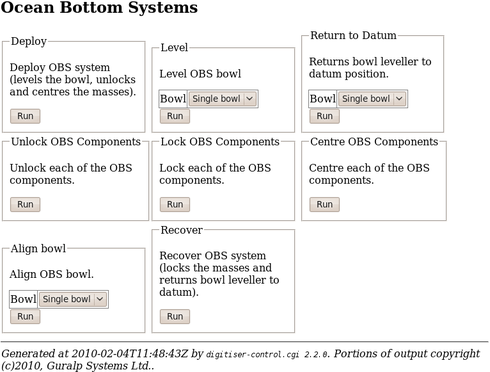
Where the attached device supports additional functions, such as bowl-levelling in an ocean-bottom system, additional controls will appear on this screen to support these features.
 The screen is shown here in sections. The first deals with the sensor masses. Buttons are provided to query the mass positions, to lock the masses for transport and unlock and centre them for deployment. The verbatim output from the attached device is displayed in each case. Where a specific device does not support a specific function, the command is safely ignored.
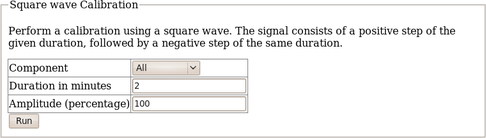
The second section of this web page deals with calibration. Note that all entered values must be integers so, for example, if you wish to calibrate with a 0.5Hz sine-wave, this should be entered as a 2 second period. Please refer to the relevant manuals for your digitiser and sensor for more details of these options.
The screen looks like this (shown in sections):
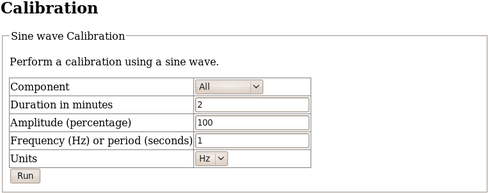
The Amplitude value refers to an arbitrary full-scale output from the calibration circuitry. It can be left at 100% unless clipping is observed, in which case it should be reduced until an undistorted output is observed.
The square wave (step) and random calibration dialogues are similar:

The final section of the screen deals with the gimbal-mounted sensors deployed in ocean-bottom systems, which need control of their levelling and orientation functions. Where triaxial systems are mounted in a single bowl, the Bowl drop-down-menu should be left at “Single bowl”. Where separate bowls are used for each component, the relevant component should first be selected from the menu.
13.2.2.2 Digitiser/Sensor Control - Command line
Platinum provides both a high-level and a low-level interface to connected digitisers. The low-level interface involves interacting directly with the command-line of the digitiser and is described at the end of this section.
The high-level interface is provided by the adc-command command, which takes a number of sub-commands as described below. Each command must be directed to a specific sensor and this must be specified as the first argument. When invoked with no arguments, or with the --help argument, a list of available targets (referred to as “modules”) is displayed:
eam2010 ~ # adc-command --help
usage: adc-command <module> <command> [options...]
======== Available ADC modules ========
C914-3K55
C914-3K56
This is followed by a list of available sub-commands. In the descriptions below, module should be replaced by a name from the list provided by invoking adc-command --help.
adc-command module mass-centre
Perform a centring operation on the sensor's masses. This sub-command takes no options.
adc-command module mass-query
Display the current mass positions of the sensor. This sub-command takes no options. The masses are displayed in counts, every second for six seconds.
adc-command module mass-lock
Lock the masses for transportation. This sub-command takes no options.
adc-command module mass-unlock
Unlock the masses for deployment. This sub-command takes no options.
adc-command module calib-sine arguments
Perform a sine-wave calibration according to the specified arguments, which are given as a space-separated list of key=value pairs:
component=[ ALL | Z | N/S | E/W ] - specify the component(s) to be calibrated
duration=m - specify the duration, in minutes, where m is an integer value. For accurate results, the duration should be significantly longer than the response time of the instrument.
amplitude=a - specify the amplitude, where a is the integer percentage of the full output of the cailbration signal generator. This can normally be given as 100 but should be reduced if clipping is noticed.
freq=n - specify the frequency (in integer Hertz) or period (in integer seconds) of the calibration signal, according to the setting of...
freq_or_period=[ Hz | sec ] - specifies whether the value associated with freq is interpreted as Hertz or seconds.
adc-command module calib-step arguments
Perform a step calibration according to the specified arguments, which are given as a space-separated list of key=value pairs:
component=[ ALL | Z | N/S | E/W ] - specify the component(s) to be calibrated
duration=m - specify the duration, in minutes, where m is an integer value. The calibration signal will first go negative for this duration, then back to zero for the same duration, then go positive for this duration, then return to zero again for the same duration. For accurate results, the duration should be significantly longer than the response time of the instrument.
amplitude=a - specify the amplitude, where a is the integer percentage of the full output of the cailbration signal generator. This can normally be given as 100 but should be reduced if clipping is noticed.
adc-command module calib-noise arguments
Perform a broad-band noise calibration according to the specified arguments, which are given as a space-separated list of key=value pairs:
component=[ ALL | Z | N/S | E/W ] - specify the component(s) to be calibrated
duration=m - specify the duration, in minutes, where m is an integer value. For accurate results, the duration should be significantly longer than the response time of the instrument.
amplitude=a - specify the amplitude, where a is the integer percentage of the full output of the cailbration signal generator. This can normally be given as 100 but should be reduced if clipping is noticed.
adc-command module obs-deploy
Deploy an OBS system by levelling the bowl, then unlocking and centring each mass in turn. This sub-command takes no options.
adc-command module obs-level bowl=which
Level the bowl or bowls of an OBS system. The parameter which should be one of 1BOWL (for single-bowl units), Z, N/S or E/W.
adc-command module obs-datum bowl=which
Return the levelling bowl of an OBS system to the datum position. The parameter which should be one of 1BOWL (for single-bowl units), Z, N/S or E/W.
adc-command module obs-unlock
Unlock each of the masses for deployment of an OBS system. This sub-command takes no options.
adc-command module obs-lock
Lock each of the masses for deployment of an OBS system. This sub-command takes no options.
adc-command module obs-centre
Centre each of the masses for deployment of an OBS system. This sub-command takes no options.
adc-command module obs-align bowl=which
Align the levelling bowl of an OBS system. The parameter which should be one of 1BOWL (for single-bowl units), Z, N/S or E/W.
adc-command module obs-recover
Prepare anOBS system for recovery by locking the masses and returning the bowl leveller to its datum position. This sub-command takes no options.
The CMG-EAM also provides the ability to connect to the terminal of any connected Güralp digitisers in order to configure their operation and control the attached sensors. To do this, connect to the CMG-EAM terminal as in section 2.1 or 2.2 and run the “data-terminal” command.
eam999 ~ # data-terminal
Select the desired digitiser (using the up/down arrow keys and Enter to select) from the list that is presented:
This will launch a minicom session (see section 14.4), allowing you to communicate with the digitiser terminal. For example:
Welcome to minicom 2.3-rc1 OPTIONS: Compiled on Feb 9 2008, 16:59:26. Port /dev/tts/0 Press CTRL-A Z for help on special keys LW B68000 CMG-5TD Command Mode 0 blocks in buffer | 256 blocks free Guralp Systems Ltd - DM+FW v.103 mgs 13/02/08 (Build 65) CTRL-A Z for help |115200 8N1 | NOR | Minicom 2.3-rc | VT102 | Offline |
If the session closes due to a time-out (or you close it manually by issuing the GO command) then you will see the message Killed by signal 15 and minicom will exit shortly thereafter.
If you wish to upload new digitiser firmware, please follow the digitiser manual to prepare it to accept firmware, then use the standard minicom “Send files” (+ ,
,  ) command to initiate an X-Modem upload. Refer to section 14.4 for instructions on using Minicom. Digitiser firmware files may be found under the directory /usr/share/firmware on the CMG-EAM. Once downloaded, please follow the instructions given in the digitiser's manual to complete the process.
13.2.3 Rebooting
The “Reboot” item on the “Control” menu allows CMG-EAMs and CMG-DCMs to be rebooted. CMG-NAMs can be both rebooted and powered off. To reboot from the command line prompt, use the reboot command.
eam999 ~ # reboot
13.2.4 Services
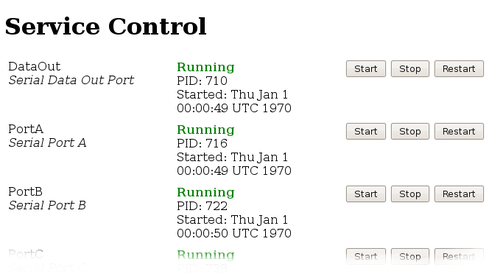
The “Services” item from the “Control” menu takes you to the Services Control screen. This screen gives a list of all configured services: services are the background programs that read, convert and and write data and carry out the individual functions of the CMG-EAM.
The services are presented in three columns. In the first is given the name of the service and, in italics, its description. The second column shows the word “Stopped” in red for any services which are not running and, for those which are running, the PID (process ID, a unique number which the operating system uses to keep track of running programs) and the date and time that this instance of the service was started. The third column has buttons allowing you to stop, start or re-start each service.
 It is possible to monitor and control services from the command line using the ps command and various scripts in /etc/init.local and /etc/init.d. This should be familiar to Linux users but full details are beyond the scope of this manual.
13.2.5 RAID Array Services
RAID arrays provide increased data security at the cost of extra storage devices. They can prevent the loss of data in the event of a single drive failure. The “RAID Array Services” item on the “Control” menu will only be displayed on CMG-NAMs with RAID fitted. It displays a page which reports the status of and allows simple control of the fitted RAID array. The status of swap partitions are also reported on this page.
13.3 Tools Menu
13.3.1 Passwords
The password-change facility is described in section 2.3.
13.3.2 GCF Audit Log Viewer
Detailed information about every GCF packet sent or received are stored on the GSL-EAM and can be viewed with the GCF Audit Log Viewer. To access the GCF Audit Log Viewer from the web interface, click on “GCF audit log viewer” on the “Tools” menu. To access the same information from the command line, enter the command
gcflogview
The initial screen displays all GCF data sources and sinks in a table, together with some summary information. In the example given, it can be seen that Ports B and F are inactive, Port A was receiving GCF data until 16:36 and the default instance of the Scream network server was sending GCF data until the same time.
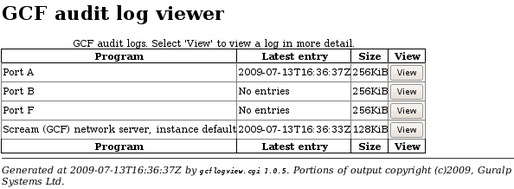
The “Size” column shows the size of the log buffer allocated to each data source or sink. The log buffer size can be changed from the relevant service or port configuration screens in expert mode.
For example, to allocate a larger log buffer to the GCF receiver running on Port A, click on “Serial ports” from the main menu, then on “Port A - GCF in”, “GCF input settings” and then click the “Expert” button. You will see a drop-down selection list labelled “Audit log size” from which you can select 64Kib, 256Kib, 2MiB or 16MiB.
To change the GCF audit log buffer size for the Scream network server, select “Services” from the “Data transfer/recording” section of the “Configuration” menu then click on “GCF Scream network server”. Click on the entry for the instance you wish to change and then click the “Expert” button at the bottom of the page. You will see a drop-down selection list labelled “Audit log size” from which you can select 64Kib, 256Kib, 2MiB or 16MiB.
Each entry in the table has a “View” button, which shows detail from the relevant log at block (packet) level). The view for Port A is shown here:
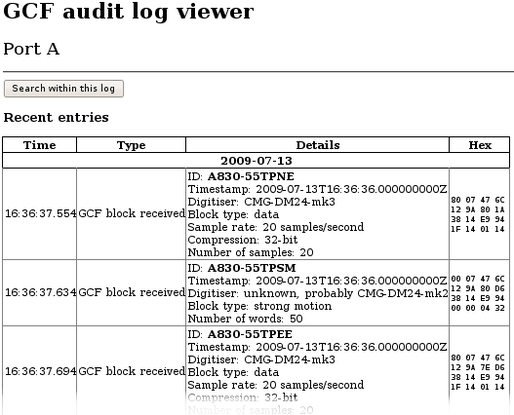
The first column shows the time-that the block was received (not the time-stamp on the block itself) and the second column shows the event type - “GCF block received” in most cases.
The “Details” column shows the stream ID from the received data block and the block time-stamp. The digitiser ID is shown if it is encoded in the block; otherwise, a best guess is displayed. The rest of the entry shows the block type, sample rate, compression level and the number of samples in the data block.
A hexadecimal display of the block header is shown in the final column.
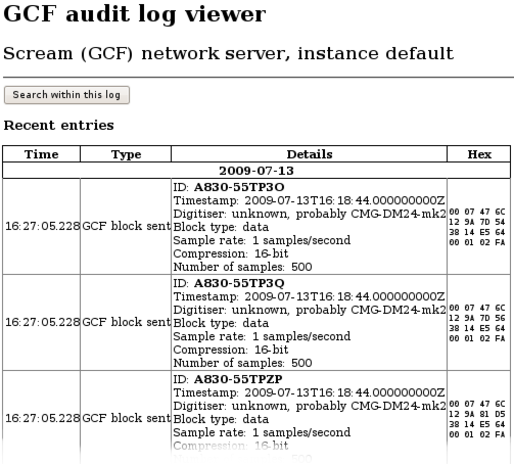 An example of an audit log display for an out-going data-stream is shown below. This data is for the Scream network server:. The first column now shows the time that the block was transmitted; other details are the same as in the previous example.
13.3.3 GDI Channels Display
It is often useful, particularly when configuring a CMG-EAM for a complex array, to see a list of the Stream IDs, or channel names, which the CMG_EAM is receiving. The GDI Channels Display feature allows you to view a list of all active channels, together with some additional detail about each.
To access the GDI Channels Display from the web interface, click on “GDI Channels Display” on the “Tools” menu.
Similar information is available from the command line via the command gdi-dump with the --list-only option but the format is optimised for automated processing rather than human consumption. Giving the --help option provides usage details. Use of the web interface, however, is recommended.
The following summary screen is displayed:
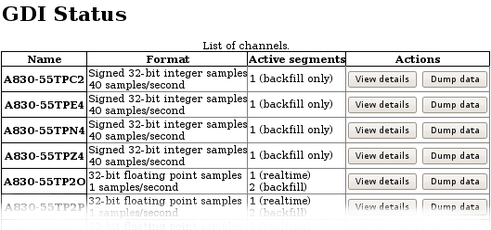 The first two columns show the names of the channels, together with information about the data format. The Active segments column shows details of data currently being received. A segment is a contiguous sequence of blocks so any data being back-filled always requires separate segments.
For each channel, you have the option of viewing detailed information about the data or the data itself, by use of the “View details” and “Dump data” buttons.
The “View details” button displays the following screen, shown here in parts:
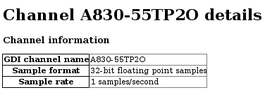
The first section of the screen, above, shows the channel name, sample format and sample rate, as seen on the previous screen.
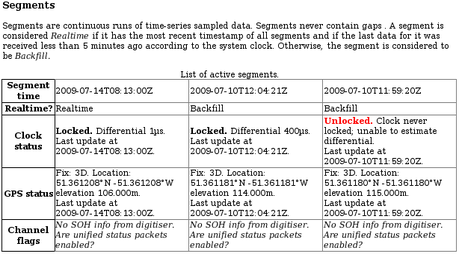
The next section of this screen, above, shows, for each active segment, detailed information decoded from the packet header.
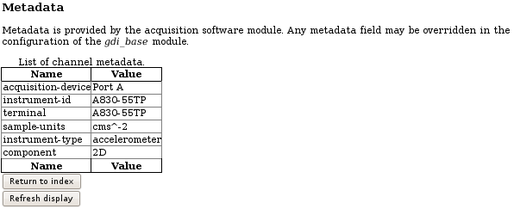
The final section, below, shows the metadata associated with the stream, which is derived from the configuration parameters of the relevant input module:
The “Dump Data” buttons associated with each channel on the GDI Status display screens like the following:
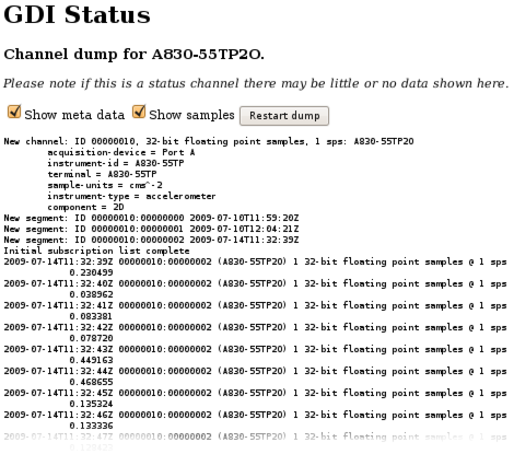 Check-boxes are available to toggle the display of both metadata and sample data. These can be changed at any time and the “Restart dump” button used to refresh the display.
For sample data, each line displays the sample's time-stamp, the segment ID, the channel name in parentheses, the sample type and the actual sample value.
A button at the bottom of the screen allows the display to be refreshed with current data. There is also a button which, when clicked, returns the user to the main GDI Channels Display index page, so that another channel can be inspected.