Chapter 3. Installation and Configuration
The Scream! software is available free-of-charge by request to mailto:scream@guralp.com. Please specify, when ordering, your name, any organisational affiliations, the equipment (instruments and digitisers etc) that you are using and the operating system on which you wish to run the software.
3.1 Installation on Windows
Scream! for Windows is delivered as an installer-packaged application so you will receive a single .exe file. Run this file and follow the instructions on screen. Please see section 3.3 for initial configuration steps.
Note: Windows users may have to reconfigure the Windows FireWall in order to allow Scream! to communicate properly.
Under Windows, the first time that you start Scream!, Windows may ask you to specify how you wish Scream! to interact with the Windows Firewall. Because Scream! requires network communication in order to function, it is important that you understand the options available.
The following screen is displayed:
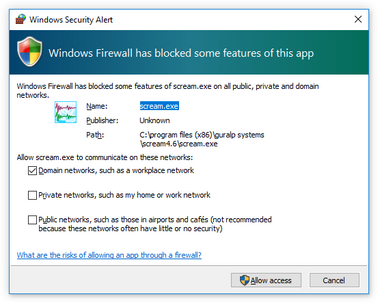
The screen provides three check-boxes which indicate whether Scream! can communicate with networked devices in the “Domain” profile, the “Private” profile or the “Public” profile. (Profiles are also known as “network locations”.)
The “Domain” profile applies to networks where the host system can authenticate to a domain controller. The “Private” profile is a user-assigned profile and is used to designate private or home networks. The default profile is the “Public” profile, which is used to designate public networks such as Wi-Fi hotspots at coffee shops, airports, and other locations.
For a more complete discussion of this topic, please see www.tenforums.com/tutorials/6815-network-location-set-private-public-windows-10-a.html or your Windows documentation.
Select which of the profiles you wish to allow Scream! to operate in and click the  button to proceed.
3.2 Installation on Unix or Linux
Scream! for Unix/Linux is delivered as either an RPM package or a .tar.gz compressed archive. For users of Debian GNU Linux-based distributions, such as Ubuntu, the alien command can be used to create a .deb package from the RPM.
The package includes a binary called scream and a wrapper script called scream.sh, which must be used when starting the program. It is usually convenient to create a symbolic link to the wrapper script with a command like
sudo ln -s /usr/lib/scream4.6/scream.sh /usr/bin/scream
Scream can then be started from the command line by simply typing scream.
Special instructions for users of 64-bit systems are available from our web site at http://www.guralp.com/howtos/running-scream-on-64-bit-linux.shtml.
Ubuntu users should also visit http://www.guralp.com/howtos/Ubuntu-Scream-Dash.shtml, which describes integration with the Ubuntu Dash.
3.2.1 Installation from an RPM or .deb
You can normally use your package manager to install Scream! in the usual fashion. On some systems, however, you may need to use the ‑‑nodeps option with rpm, the ‑‑force-depends option with dpkg or a similar option with other package managers. Please see section 3.3 for initial configuration steps.
3.2.2 Installation from a .tar.gz archive
The archive is created with relative file-paths and contains, at its root, a single directory, scream-4.6. It should be unpacked (using
sudo tar ‑xzf scream‑4.6.tar.gz
or an equivalent command) into a suitable location, such as /usr/lib. After unpacking, you need to copy a file to the system library directory (usually /usr/lib) and create a symbolic link. You normally need to have root authority to do this.
Change your working directory to the scream‑4.6 directory and issue the following commands:
sudo cp libborqt-6.9.0-qt2.3.so /usr/lib/
sudo ldconfig
You may wish to change the owner and group of the extracted files according to your local policy.
Once fully installed, the application should be started with the command
/{install_path}/scream-4.6/scream.sh (or via a symbolic link, as described at the beginning of section 3.2). Please see section 3.3 for initial configuration steps.
3.3 Initial Configuration – all platforms
Scream!'s Setup screen (available under the File menu) allows you, amongst other things, to set the location of data files and log-files. It is wise to set these before proceeding. You can view the Setup screen whenever the Main Window is in focus by keying  +
+ .
.
The folders/directories in which you choose to place these files must be writeable by you. They will be created when needed (if they do not already exist) as long as the parent folder/directory is writeable by you.
Note: Configured paths are not parsed by any command shell, so sequences such as ~ (home directory for Linux/Unix users) or %AppData% (the application data directory for Windows users) will not do what you might expect.
Note: As the data files can grow quite large, Windows users who use roaming profiles should pick a location which avoids having to transfer these files over the network each time they log on or off. Similar concerns may apply to Linux/Unix users in complex network environments.
The directory used for storing incoming stream data is set using the Base Directory item on the Files tab of the set-up dialogue. For detailed control of the file-names used, see section 11.1.2.
The directory used for storing logging information is set using the Directory item on the Event Log tab of the set-up dialogue. For more information, see section 13.