Chapter 3. Configuration and Operation
3.1 IP network configuration
This section assumes that you already have a copy of Scream! running and configured to receive data from your seismic network. ArrayMon can be run either on the same PC or on a different PC.
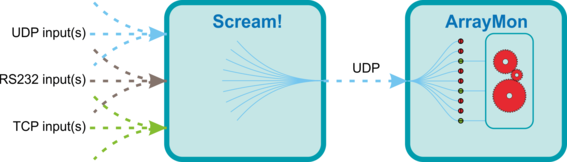
Data collected by Scream! are transmitted to ArrayMon using UDP packets over an IP network. In the case where both programs run on the same PC, this network is just the IP loop-back interface, identified by the IP address 127.0.0.1. Scream provides coarse control over which streams are forwarded but the ArrayMon configuration allows streams to be selected for processing on a one-by-one basis.
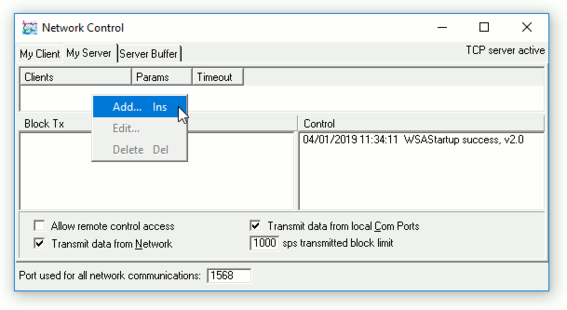
Scream! must be configured to push data to ArrayMon. To do this, open Scream!'s "Network Control" window by starting Scream! and, from the main window, key  +
+ . In the "Network Control" window, switch to the "My Server" tab, right-click in the "Clients" list and select "Add…" from the context menu:
A window appears into which you can enter the IP address and UDP port for the instance of ArrayMon:
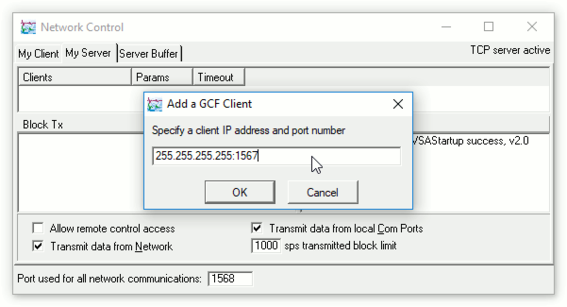
The default value is a broadcast address. Overwrite this with:
the IP address of the PC running ArrayMon (if it is the same PC as that running Scream!, use 127.0.0.1); followed by
a colon (":"); followed by
an appropriate destination UDP port number (see below).
then click  .
.
The destination UDP port number should be greater than 1024. It must not be Scream's "Port used for all network communications" and it be unused by any other application on the PC running ArrayMon. If you have no particular policy for allocating ports, use 15670 and see the note below.
Note: If the chosen destination UDP port does not work for any reason, simply pick a different port number. Right-click on the client entry in the "My Server" tab of Scream!'s "Network Control" window and select "Edit…" from the context menu. Change the port number and click . You then need to change the listen port number in ArrayMon to match, as described below.
The source port for UDP data from Scream - i.e. the port from which the UDP packets are transmitted - is configured via the "Port used for all network communications" field at the bottom of the "My server" tab of the "Network Control" window. This does not normally need to be changed.
Now tick one or both of the check-boxes "Transmit data from local Com Ports" and "Transmit data from Network", depending on the source(s) of the data coming into Scream. If you have multiple streams at different sample rates from the same channels, you may wish to reduce the "sps transmitted block limit" value to exclude the higher-rate streams. Scream should now be forwarding the selected data to the chosen IP address and UDP port.
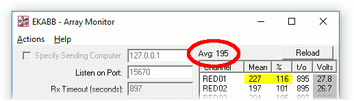
Open ArrayMon and, in the main window, set the "Listen on Port" to the destination UDP port number configured in Scream in the previous step.
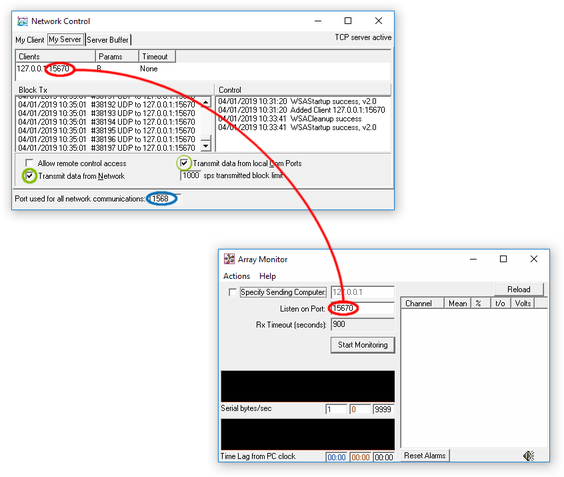
ArrayMon will listen on this port and accept any incoming packets. If you wish to restrict which packets are accepted based on their source address, tick the "Specify Sending Computer" check-box and enter the IP address of the PC running Scream!. If the same PC is running both Scream! and ArrayMon, use the loop-back address: 127.0.0.1.
ArrayMon is now configured to receive the data forwarded by Scream!, although no streams will appear in the display until you configure the seismic network - as described in the following section - and click the  button.
3.2 Seismic network configuration
To configure which streams should be monitored by ArrayMon, open its configuration file using notepad++ or an equivalent text editor. The configuration file is called arraymon.ini and should be located in the same folder as the arraymon.exe program. It is created when you make a configuration change using the main window - typically when you set the "Listen on Port" - or when you exit the ArrayMon program.
Note: If you cannot see the file, exit and restart ArrayMon. If it is still missing, Windows may have moved it to the Virtual Store. See section 4.1.1 on page 38 for details.
Using the text editor, add a new section header
[Channels]
at the end of the file, followed by a list of the streams which you wish to monitor. Each line should consist of
a stream specification in the form
SystemID followed by
a hyphen ("-") followed by
Stream ID (Serial Number, component ID and tap ID)
an equals sign ("=")
a "display name" which is used to identify this stream within ArrayMon
For example, to receive a stream with ID GSL-TESTZ2 and display it with the name DEMO, enter a line
GSL-TESTZ2=DEMO
Note: Other parameters can be added to this line later - see section 3.8 on page 30 for details.
Once you have added your desired streams, click "Save" in your text editor and then click  in ArrayMon. (Alternatively, select "Reload INI file" from ArrayMon's "Actions" menu.)
Each of the specified streams will appear in a row in the list in the main ArrayMon window. Initially, the only populated field in each row will be the "display name" in the Channel column.
Click . For each channel, ArrayMon will initialise the time-out (t/o) column and start listening for incoming data packets. See section 3.5.3 on page 23 for information about time-outs and associated alarms.
If a packet for a specified stream arrives, ArrayMon will reset the time-out counter and populate the "Mean" column with the mean sample value from the packet.
If a configured channel does not appear to be being updated, check first that the data are arriving in Scream! as expected and then check that the relevant entry in arraymon.ini corresponds exactly to the System ID and Stream ID as seen in Scream.
Note: You can edit, save and re-load arraymon.ini without having to exit the ArrayMon program.
3.3 The main window
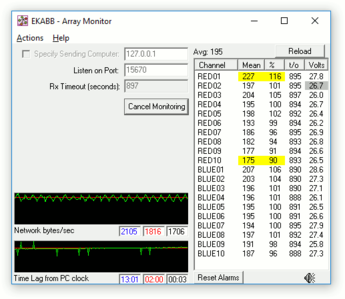
The ArrayMon application's main window can be considered in three sections.
3.3.1 Configuration
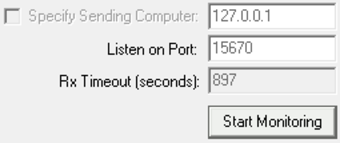
The top left of the display contains configuration items:
the "Specify Sending Computer" check-box and field can be used to reject data from unwanted sources, as described in section 3.1 on page 7;
the "Listen on Port" field is used to specify the UDP port on which the application listens for incoming data, also described in section 3.1 on page 7; and
the "Rx Timeout (seconds)" field is used to configure the "missing data" time-out, as described in section 3.5.3 on page 23. This can only be done when the application is not monitoring.
This area also contains either the button or the  button, depending on whether the application is currently monitoring or not.
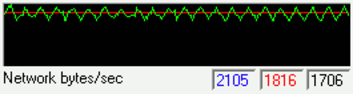
3.3.2 Graphs
The bottom left of the display contains two graphs.
The first shows the number of bytes of data being received (but see the note below). This is indicated by the green trace; the average over the period displayed is indicated by the red line.
Received packets which are not processed (because there is no matching line in the Channels section of the configuration files) are not counted.
Note: Incoming streams are assumed to have come into Scream! using the BRP transport protocol and the traffic figures are inflated accordingly, adding an appropriate value to account for the BRP protocol overhead. If, instead, the scream protocol was used to bring data into Scream, set the RateUnit parameter in the configuration file to 2. The protocol overhead values used will be adjusted accordingly. See section 3.8.2 on page 33 for details.
The legend for this graph will "Serial bytes/sec" when RateUnit is set to 1 and "Network bytes/sec" (as shown above) when RateUnit is set to 2.
The graph is updated every second and shows the previous 260 seconds (just over four minutes) of data.
The three figures below the graph show:
Blue: the maximum value over the last 260 seconds;
Red: the average value over the same period. This value is also shown on the graph as a horizontal red line; and
Black: the current value - i.e. the number of bytes processed during the preceding second.
The second graph shows the time difference between the incoming data and the PC's clock. This is indicated by the green trace:
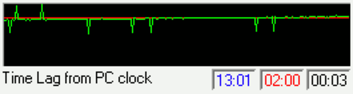
A complex algorithm combines data from the time-stamp of the last sample in each time-series packet and the time-stamp of the last line in each status packet. The minimum value for each instrument is calculated - this provides a good estimate of the total system latency - and then the minimum value across all instruments is displayed.
Note: While this feature gives you a good measure of your seismic network's latency, it cannot alert you to a problem which results in high latency, unless that problem is array-wide.
The graph is updated every ten seconds and shows 2,600 seconds of data - a little under 45 minutes.
The three figures below the graph show:
Blue: the maximum value over the period displayed;
Red: the average value over the period displayed. This value is also shown on the graph as a horizontal red line; and
Black: the current value - i.e. the number of bytes processed during the preceding ten seconds.
3.3.3 Channels
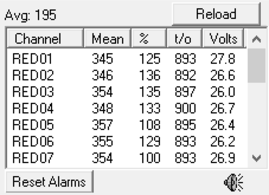
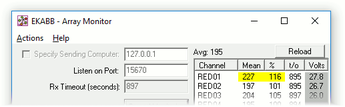
The right-hand side of the main window shows the channels list:
Every channel specified in the arraymon.ini configuration file will appear in this list, whether or not data have been received.
The "Channel" column shows the "display name", as defined in the configuration file. Individual entries may be shown with coloured backgrounds:
grey indicates that insufficient data have been received for the system to start functioning normally. This condition will normally clear itself within a few minutes as more data arrive. The array-wide average ("Avg" - see below) will be displayed as zero during this period.
red indicates that the upper or lower "Deviation from array average" threshold (see section 3.5.5 on page 24) has been exceeded for this channel for more than the configured time-out period (see the overview of warnings and alarms in section 3.5.1 on page 22) and an alarm has been raised.
maroon indicates that the upper or lower absolute threshold (see section 3.5.6 on page 25) has been exceeded for this channel for more than the configured time-out period and an alarm has been raised.
The second column, "Mean", shows the mean of the absolute value of the associated channel (after DC removal), computed over the preceding five minutes. The average of these values across all active channels is displayed above the list as "Avg":
The third column, "%", shows the channel mean as a percentage of the all-channel average. This value can be monitored and warnings or alarms raised if it varies beyond pre-determined limits: see section 3.5.5 on page 24 for details.
Individual entries in the "Mean" and "%" columns may be shown with coloured backgrounds:
yellow means that the configured warning level has been exceeded. This indication will be displayed for as long as the condition exists.
red means that the configured alarm level has been exceeded. When a channel enters this state, a timer is started. If the level is still exceeded after a configurable period has elapsed (see "Time to Alarm" in section 3.7.1 on page 28), an alarm is declared and the channel name is then also displayed with a red background. The audible alarm will sound, if it is enabled.
maroon indicates that the upper or lower absolute threshold (see section 3.5.6 on page 25) has been exceeded for this channel. When a channel enters this state, a timer is started. If the level is still exceeded after the "Time to Alarm" period, as above, an alarm is declared and the channel name is then also displayed with a maroon background. The audible alarm will sound, if it is enabled.
Note: If the mean value returns to below the threshold within the period, the highlighting in the "Mean" and "%" columns will be removed automatically. Once any alarm condition has lasted longer than the "Time to Alarm" period, however, the indication will remain displayed until explicitly reset, as described below.
The fourth column shows the incoming data packet time-out, as described in section 3.5.3 on page 23. If this value reaches zero, it is displayed with a red background.
The final column shows the supply voltage, as determined from the status stream associated with the channel being monitored. This value can also be monitored, as described in section 3.5.4 on page 24.
Note: It can often take ten minutes or more before the first status packet populated with a supply voltage value is received. The entry in the column will be blank until then.
Individual entries may be shown with coloured backgrounds:
grey indicates that no threshold value has been set in the configuration file for this channel.
red indicates that a supply voltage figure has been reported which is less than the configured threshold. An SMS message will be transmitted if the system is so configured: see section 3.7.1 on page 28.
Above the channel table is a button, , which causes the application to re-read its configuration file. Various dynamic data, such as channel mean values and supply voltage readings, are reset.
Below the table is another button,  , which clears all existing alarm conditions. Beside this is a button icon which shows whether or not audible alarms are enabled. Click the button icon to enable or disable audible alarms:
 - audible alarms are enabled: click to disable them;
 - audible alarms are disabled: click to enable them.
3.3.4 Menus
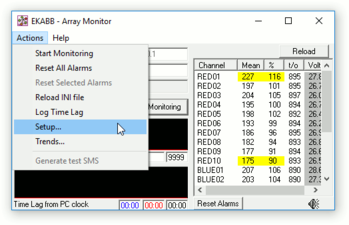
The main screen provides two menus: "Actions" and "Help". Each menu item has an associated key-sequence. The "Actions" menu contains the following items:
Start Monitoring (
 +
+ ,
,  ) / Cancel Monitoring (+,
  )
)These items have the same effect as the
and buttons on the main screen.Reset All Alarms (
+,  )
)This item has the same effect as the
button on the main screen.Reset Selected Alarms (
+,  )
)Reload INI file (
+,  )
)This item has the same effect as the
button on the main screen.Log Time Lag (
+,  )
)This item controls whether the "Time Lag from PC clock" data are logged to the PC's file-system or not. When logging is enabled, a blue tick is shown next to the menu item:
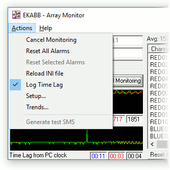
The data are written in CSV (comma-separated variable) format to the file-system. See section 4.2 on page 38 for details of the file location and format.
Setup… (
+,  )
)This item opens the "Setup" window, as described in section 3.7 on page 27.
Trends… (
+,  )
)This item opens the "Channel Trends" window, as described in section 3.4 on page 17.
Generate test SMS (
+,  )
)This item causes a test SMS message to be generated and sent to all of the recipients listed in the "Setup" window, as described in section 3.7.3 on page 29.
The "Help" menu displays the configured title (see section 3.8.2 on page 33) and the program's version:
3.4 The Channel Trends window
ArrayMon can display the medium- or long-term trends of every configured channel in a single graph. To view this, select "Trends…" from the "Actions" menu on the main screen:
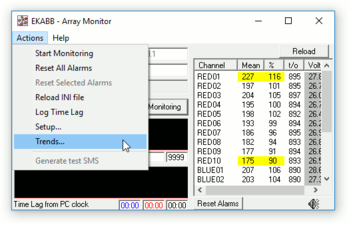
or key  + then
  . The following screen is displayed:
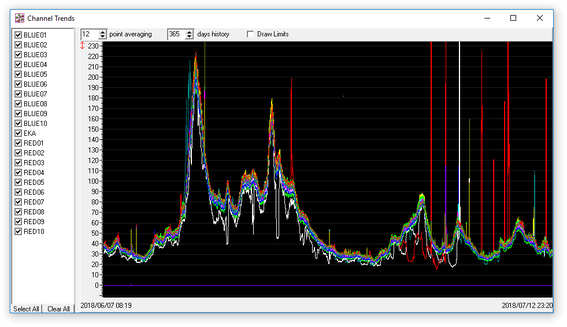
An additional trace showing the array average is also displayed. This is, by default, unnamed but you can provide a title by editing the configuration file (see section 3.8 on page 30) and adding the following line to the [Settings] section:
Title=myTitle
substituting the required title in place of myTitle. The same title is also used in the title-bar of the main window and in screen displayed by the "Help" menu item.
A list of channels being processed is displayed on the left of the window with a check-box next to each.
To highlight the data for any particular channel, click on the channel name in this list. The associated trace will be moved to the front of the graph and emboldened.
Note: If a single channel name is selected, you can move through the channels using the
 and
and  keys. This can be useful to discover the identity of a trace on the graph.
To compare the data for two or more channels, click in the list on the first channel of interest and then
-click on the rest. The associated traces will each be moved to the front of the graph and emboldened in the order in which you click on them. To return the graph to normal, key  (or -click on each selected channel).
To hide the data for channels which are not currently of interest, clear the check-box next to the channel name. The buttons at the bottom of the list,
 and
and  can be used to make bulk changes.
To change the vertical magnification, hold down the left mouse button while dragging the mouse over the vertical scale, as shown:
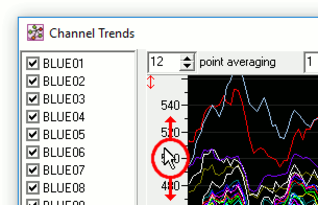
The fact that the magnification has changed is indicated by a small, double-headed red arrow (
 ) at the top left of the scale. To return to the default magnification, right-click on the scale: the vertical axis will be automatically scaled to cover the range from zero to the maximum value across all traces.
To zoom in to any area of the graph, hold the left mouse button down while dragging the mouse over the area of interest:
To zoom out again, right-click anywhere in the graph. A list of previous zoom settings is retained and each right-click takes you to the previous view. When the list is exhausted, the horizontal axis will show the time period selected by the history control (see below) and the vertical axis will be automatically scaled to cover the range from zero to the maximum value across all traces.
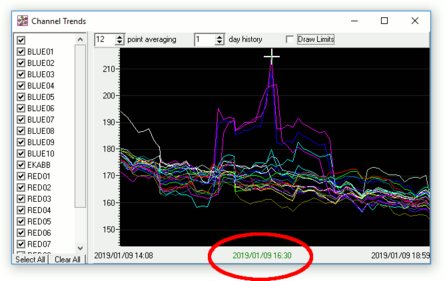
To determine the time of any feature of the graph, move the mouse pointer to the point of interest: the cursor will turn into a cross-hair and the green text located centrally below the graph will display the associated date and time:
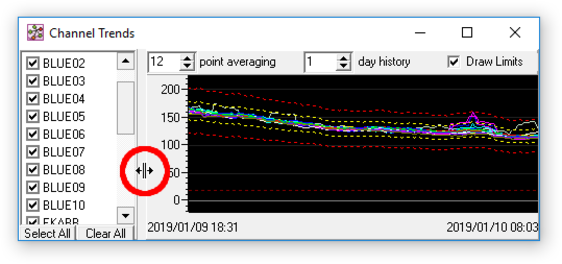
The width of the channel list pane can be changed by holding down the left mouse button while dragging the border between the two sections to the left or right:
There are three controls at the top of the window above the graph:

n-point averaging - by default, the graph displays a rolling average over 12 data-points but this value can be changed. Increase the value of n to provide additional smoothing, which makes long-term trends easier to see. Decrease the value of n to display a spikier, more detailed trace.
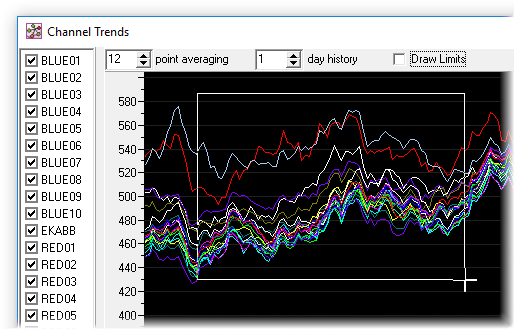
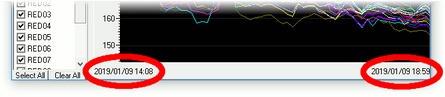
n-days history - this parameter controls the time period covered by the graph. The start date/time and end date-time of the displayed period are shown at the bottom left-hand and bottom right-hand corners of the graph, respectively:
Draw Limits - when this check-box is ticked, additional traces are added to the graph to indicate the current warning and alarm settings. The diagram below shows the effect of this:
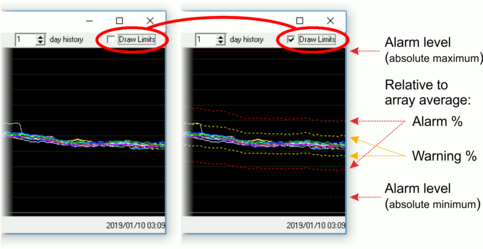
The red, dotted, horizontal lines labelled "Alarm level (absolute maximum)" and "Alarm level (absolute minimum)" in the diagram above indicate the absolute threshold alarms. These are set via the configuration file and discussed in section 3.5.6 on page 25.
The red and yellow dotted lines labelled "Relative to array average" in the diagram above indicate the "deviation from mean" alarms and warnings. These are set via the "Setup…" screen (accessible from the "Actions" menu) and discussed in section 3.5.5 on page 24.
Note: The data used to prepare this graph are stored in persistent files with a .trend extension. See section 4.2 on page 38 for more details.
3.5 Warnings and Alarms
3.5.1 Overview
ArrayMon can be configured to monitor various parameters for exceptional conditions, as described in the following sections. Should such a condition occur, a warning or alarm is raised as described below.
Warnings are indicated by a yellow highlight in the appropriate column(s) of the channel list in the main display. Warnings clear themselves automatically when the condition responsible is no longer present.
Alarm conditions are indicated and logged immediately. If the condition clears within a configurable period (see "Time to Alarm" in section 3.7.1 on page 28), the indication is cleared and the fact that the alarm was cancelled is logged. If the condition persists, further actions are taken, as described below.
The initial alarm condition is indicated by a red or maroon highlight in the appropriate column(s) of the channel list in the main display and by an entry in the daily log-file (see section 4.2 on page 38).
If the condition persists for longer than the configured "Time to Alarm",:
The red or maroon highlight in the main display is copied to the channel name column;
an audible indication is given (if enabled - see section 3.3.3 on page 14 and section 3.8.2 on page 33);
an SMS message is issued (see section 3.7.3 on page 29); and
the contents of the SMS message are written to the daily log file (see section 4.2 on page 38).
The red highlight in the channel name column will remain in place and the audible warning will continue to sound until the operator either:
clicks the
button; orclicks the "Reset Selected Alarms" item from the "Actions" menu after selecting one or more rows from the channel display.
A single row can be selected by clicking on it;
Additional rows can be selected or deselected by holding
 while clicking on them;
Multiple adjacent rows can be selected by clicking on the first and then holding
 while clicking on the last; and
All currently-selected rows can be deselected by keying
 .)
.)
Audible alarms can be silenced without resetting the visual indication by clicking the mute button () on the main screen.
Note: Clicking the button will return the mute status to its default setting, as defined by the DefaultMute setting in the configuration file - see section 3.8.2 on page 33.
3.5.2 Out-of-hours
During the daytime, an operator can be assumed to be interested in every alarm. During the night, however, some institutions take a more relaxed attitude and would only want to alert an operator in the event of a more serious problem.
ArrayMon supports this by providing a mechanism to define an "out-of-hours" period and a threshold value - a small integer. During the defined out-of-hours period, alarms are counted but not reported via SMS until the number of alarms exceeds the defined threshold value. If the threshold value is not exceeded, the alarms will be displayed visually and audibly until the operator returns to the PC and cancels them.
The threshold value and the start and end of the "out-of-hours" period are defined using the "Setup" window - see section 3.7.2 on page 29 for details.
3.5.3 Missing data
An alarm can be generated if any channel receives no data for a configurable period.
Each configured channel has its own independent inactivity counter. These counters are each initialised from the value specified on the main screen as “Rx Timeout (seconds)”. For each channel, if no packets are received, the associated timer counts downwards in seconds. When a data packet is received for a channel, the associated timer is reset to the initial value.
If any timer reaches zero, an alarm is generated for the associated channel.
This means that if, for example, you set the “Rx Timeout (seconds)” value to 300, an alarm is raised if any channel receives no data packets during any five-minute period.
Note: The “Rx Timeout (seconds)” value cannot be changed when monitoring is active. To change this value, click , adjust the value as desired and then click to resume operation.
While monitoring is active, the “Rx Timeout (seconds)” field displays the maximum value of all the channel inactivity counters.
This alarm can optionally generate an SMS message: this is configured via the "Setup…" window, described in section 3.7.3 on page 29.
3.5.4 Supply voltage
An alarm can be generated if the supply voltage associated with any channel drops below a configurable threshold.
The value of the supply voltage is determined from the status stream associated with the stream being monitored. The ID of the relevant status stream is constructed by replacing the last two characters of the ID of the stream being monitored with zeroes. For example, if you configure ArrayMon to monitor stream DEMO-TESTZ2, it will also monitor the stream DEMO-TEST00. Compatible Güralp digitisers print the supply voltage to the status stream every ten minutes.
Note: This means that it can take up to ten minutes before any value is displayed in this column after monitoring is first started.
The low-voltage threshold value must be manually entered into the configuration file on a channel-by-channel basis. It is entered as the seventh field (i.e. the last field) of each the channel definition line.
For example, if a channel definition line reads
TEST-1234Z2=DEMO 0.996 0 0 0 0 11.8
an alarm will be raised for channel "DEMO" if the associated status stream, TEST-123400, contains a report of a supply voltage of less than 11.8 volts.
See section 3.8 on page 30 for the definitions of the fields in the channel definition lines.
3.5.5 Signal - Deviation from array average
While monitoring, ArrayMon computes a rolling mean (over five minutes) of the absolute value of each channel. Any DC components are removed before these calculations. These values are displayed in the "Mean" column on the main screen (see section 3.3.3 on page 14).
These values are then averaged across the whole array and the resulting value is displayed on the main screen as "Avg". If the mean for any channel deviates too far from this array average, a warning can be raised. Warnings are indicated by a yellow highlight in the channels list, as seen for channel RED1 in the screen-shot below:
If the mean deviates further, an alarm can be raised.
The warning level and the alarm level are both configured using the "Setup…" window, accessible from the "Actions" menu:
Note: If you tick the “Draw limits” check-box in the "Trends" window (see section 3.4 on page 17), these threshold values will be indicated in the Trends graph.
Note: For this process to work across a diverse array, the incoming data values need to be normalised. This is achieved by specifying a normalisation factor in the second field of the channel specification line in the configuration file: see section 3.8.1on page 31 for more information.
The "Time To Alarm" field prevents short-term conditions from causing spurious false alarms. The alarm condition must persist for the configured amount of time before an alarm is raised.
3.5.6 Signal - Absolute limits
In addition to the limits on deviation from average described in the previous section, there are also absolute thresholds for the minimum and maximum channel mean values. If the mean value (calculated as described in the previous section) for any channel falls outside of these boundaries, an alarm is raised. The channel is considered to be in a fault condition and values from it are no longer used when calculating the cross-array average.
This facility will ensure that an alarm is raised if, for example, all sensors in an array are damaged by an electrical storm and start producing DC outputs or random, high-level noise.
If you do not configure these limits, they will default to:
minimum: 50 counts; and
maximum: 500 counts.
Note: These values are appropriate for seismic arrays but are typically too small for infrasound arrays, depending on the instrumentation used.
To configure different threshold values, edit the configuration file (see section 3.8 on page 30) and add the following lines to the [Settings] section:
MinThreshold=50
MaxThreshold=500
substituting the required values in place of the defaults. Click the button in the main screen after saving your changes.
Note: If you tick the “Draw limits” check-box in the "Trends" window (see section 3.4 on page 17), these threshold values will be indicated in the Trends graph.
3.6 Data filtering
It is possible to apply filtering to the incoming streams before they are used by ArrayMon. Both high-pass filtering and low-pass-filtering are available and they can be used independently or together as a band-pass filter. Each channel can have its own filter settings. The filters are of the nth-order Butterworth type.
High-pass filtering can be used for many purposes, including:
to compensate for an instrument that has a response with a lower low-frequency corner than others in an array
to remove unwanted low-frequency components from, for example, infrasound sensors
to remove expected long-term drift from the output of passive sensors such as geophones.
Uses of low-pass filtering include:
compensating for instruments with responses with higher high-frequency corners than others in the array
removing unwanted cultural noise that might otherwise cause false alarms.
Filters are configured by directly editing the configuration file. See section 3.8.1 on page 31 for details.
3.7 The Setup window
The "Setup" window allows configuration of many settings which control the behaviour of ArrayMon. To open this window, select "Setup…" from the "Actions" menu on the main screen:
or key + then  .
.
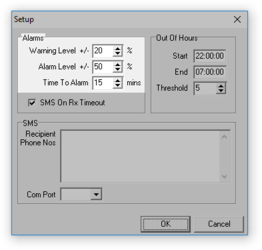
The following screen is displayed:
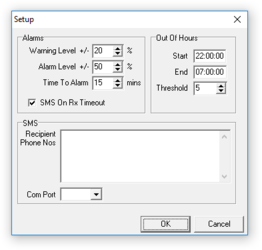
This screen can be considered in three sections: Alarms, Out Of Hours and SMS, each of which is described in a section below.
3.7.1 Alarms
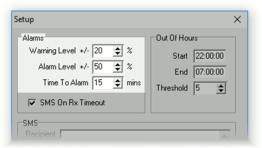
This section of the Setup window allows configuration of the "deviation from array average" warnings and alarms as described in section 3.5.5 on page 24.
The "Warning Level" control sets the upper and lower thresholds for the deviation from average, above or below which a warning is issued. These dynamic thresholds can be displayed as yellow dotted lines in the "Channel Trends" graphs, as described in section 3.4 on page 17.
Similarly, the "Alarm Level" control sets upper and lower thresholds, above or below which an alarm is issued. The alarm thresholds can be displayed as red dotted lines in the "Channel Trends" graphs.
The "Time to Alarm" control sets a delay time: the alarm condition must be present for at least this time before an alarm is raised. This prevents false positives caused by ephemeral conditions.
The final control in this section, "SMS On Rx Timeout"
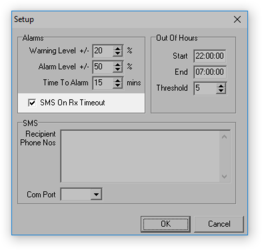
specifies whether or not an SMS message is issued if any channel inactivity counter (see section 3.5.3 on page 23) reaches zero. SMS recipients are configured in this same screen: see below.
3.7.2 Out of Hours
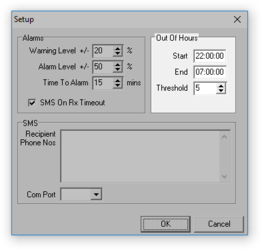
This section allows the definition of an "Out-of-hours" period, during which alarms are counted but not sent via SMS until the count exceeds the threshold. See section 3.5.2 on page 23 for details.
The "Start" and "End" fields accept times in the format hh:mm:ss where hh represents the hour of the day (0 to 23), mm represents minutes and ss represents seconds. The user's configured time-zone is used.
3.7.3 SMS
The PC running ArrayMon can be connected to a GSM/GPRS modem or a mobile telephone in order to send SMS messages. The modem or 'phone can be connected through a serial cable, a USB cable, a Bluetooth link or an infrared link provided the link presents itself to applications as a COM port.
ArrayMon uses the SMS standard extensions to the AT command set. These commands all begin +CM… and are very widely supported by many manufacturers.
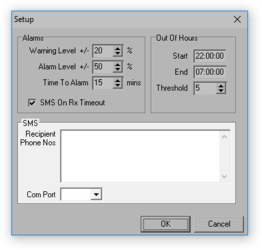
To enable this feature, connect your modem or 'phone to the PC and determine the COM port number for the connection (using Device Manager if necessary). Select this port from the "Com Port" drop-down menu.
Note: Only ports which are free will appear on this list. If the expected port number does not appear, ensure that it has not been opened by another application, such as Scream!
Now enter one or more telephone numbers in the "Recipient Phone Nos" field, one per line. The 'phone numbers should be in the format that your modem or 'phone requires. This may involve replacing the leading zero with a plus sign ('+') and country code: consult the modem or 'phone documentation for further information.
You can test this feature using the "Generate test SMS" item from the "Actions" menu on the main screen, as described in section 3.3.4 on page 16.
3.8 The configuration file
The configuration file is called arraymon.ini and should be located in the same folder as the arraymon.exe program. It is created when you make a configuration change using the main window - typically when you set the "Listen on Port" - or when you exit the ArrayMon program.
Note: If you cannot see the file, exit and restart ArrayMon. If it is still missing, Windows may have moved it to the Virtual Store. See section 4.1.1 on page 38 for details.
The arraymon.ini file uses the conventional windows "INI" format. It consists of
sections, introduced by section names enclosed in square brackets ('[…]');
settings, in the form property=value; and
comments, introduced by two solidus ('/') characters.
Blank lines are allowed.
Some settings are managed through the graphical user interface while others can only be changed by editing the arraymon.ini file and then reloading it using the button located at the top right of the main window. In the descriptions below, these are differentiated with symbols as follows:
 these settings can be edited using the graphical user interface
 these settings can only be changed by editing the configuration file.
The arraymon.ini file consists of three sections, "Channels", "Settings" and "Trends", as described in the following sections.
3.8.1 Channels
The "Channels" section of arraymon.ini is introduced by the line:
[Channels]
Below this, you must enter a list of channels to be monitored with each line describing a single channel. For each line, the key identifies the incoming stream and the associated property is a list of one, two, four, six or seven parameters in one of the following formats:
SysID-StrID=DisplayName
The channel identified by the GCF-name SysID-StrID (where SysID is the GCF system ID, StrID is the GCF stream ID and the two are separated by a hyphen) will be monitored and displayed with the name DisplayName. No processing is carried out on the GCF time-series values before they are used.
SysID-StrID=DisplayName norm
The first parameter is interpreted as described above. The second parameter, norm, must be a floating point number, such as 0.998. The GCF time-series values will be multiplied by this value - the normalisation factor - before they are used. This feature allows channels with different sensitivities to be compared directly. If normalisation is not required, set norm to unity ('1').
SysID-StrID=DisplayName norm HPF-f HPF-o
The first two parameters are interpreted as above. The parameter HPF-f must be a floating point number, such as 50.0 and HPF-o must be an integer number, such as 2. They specify the frequency and order of a high-pass Butterworth filter which is applied to the GCF time-series values before they are used. This feature allows channels with known drift or long-period signals to be monitored without raising false alarms. If high-pass filtering is not required, set both HPF-f and HPF-o to zero ('0').
SysID-StrID=DisplayName norm HPF-f HPF-o LPF-f LPF-o
The first four parameters are interpreted as above. The parameter LPF-f must be a floating point number, such as 0.05 and LPF-o must be an integer number, such as 2. They specify the frequency and order of a low-pass Butterworth filter which is applied to the GCF time-series values before they are used. This feature allows channels with known cultural noise to be monitored without raising false alarms. If low-pass filtering is not required, set both LPF-f and LPF-o to zero ('0').
SysID-StrID=DisplayName norm HPF-f HPF-o LPF-f LPF-o V
The first six parameters are interpreted as above. The parameter V must be a floating-point number, such as 14.0. It specifies a supply voltage threshold. If the supply voltage reported in the status streams associated with this channel falls below the specified threshold, an alarm is raised. See section 3.5.4 on page 24 for further details. If no value is specified, voltage monitoring is disabled for this channel.
Note: The filters used are identical to those implemented in Scream! so Scream!'s "Filter design window" can be used to experiment with parameters while developing the ideal filter for your application.
Note: Filtering can be used to help monitor a heterogeneous network containing both velocity-response and hybrid-response instruments. Contact <a "target="_blank" href="support@guralp.com">support@guralp.com if you need advice on this topic.
For example, a line like
GSL-TESTZ2=DEMO 1.1 0 0 8 4 14.0
specifies that data from the stream with System ID GSL and Stream ID TESTZ2 should be monitored and
these data should be displayed with the name DEMO
these data should be normalised by multiplying by 1.1 before they are used (typically, this would be to compensate for an instrument with a lower output than others in the array. Numbers less than unity can be used to compensate for instruments with higher outputs.)
no high-pass filtering should be applied
the data should be filtered by a fourth-order low-pass filter with a corner frequency of eight Hertz
an alarm should be raised if the supply voltage reported in stream GSL TEST00 falls below 14.0 volts.
Note: The HPF-f and HPF-o parameters must be present in this case so that the low-pass filtering and voltage monitoring parameters can be specified. Because high-pass filtering is not required in this example, these two parameters are set to zero and act here only as place-holders.
3.8.2 Settings
The "Settings" section of arraymon.ini is introduced by the line:
[Settings]
Below this, the following lines may be present:
Title=string
This property takes a string as an argument and provides a title for the title-bar of the main window and also for the array-wide average in the "Trend" window, as described in section 3.4 on page 17. If omitted, the trace representing the average is displayed with no title. It is also used as the basename of the trend file (see section 4.2) for the overall array average.
MinThreshold=n
This property takes an integer argument which specifies a minimum threshold value. If the rolling mean of any channel falls below this value, an alarm is raised, as described in section 3.5.6 on page 25. If unspecified, the default value is 50. This is suitable for typical seismic arrays but may be far too small for infrasound applications.
The list is configured via the "Setup" window, as described in section 3.5.3 on page 23.
MaxThreshold=n
This property takes an integer argument which specifies a maximum threshold value. If the rolling mean of any channel falls below this value, an alarm is raised, as described in section 3.5.6 on page 25. If unspecified, the default value is 500. This is suitable for typical seismic arrays but may be far too small for infrasound applications.
WarnPercent=n
This property takes a floating-point argument (e.g. 0.08) which is interpreted as a percentage. It specifies a threshold for the "deviation from average" warning, as described in section 3.5.5 on page 24. If the difference between the rolling mean for any channel and the average across channels rises above or falls below this value, a warning is raised. This value is configured in the "Setup" window, as described in section 3.7.1 on page 28.
AlarmPercent=n
This property takes a floating-point argument (e.g. 0.08) which is interpreted as a percentage. It specifies a threshold for the "deviation from average" alarm, as described in section 3.5.5 on page 24. If the difference between the rolling mean for any channel and the average across channels rises above or falls below this value, an alarm is raised. This value is controlled by the "Setup" window, as described in section 3.7.1 on page 28.
MinsToAlarm=n
This property takes an integer argument (e.g. 10) which specifies the number of minutes between a "deviation from average" alarm (as described in section 3.5.5 on page 24) being detected and an actual alarm being raised. This helps to guard against false-positive alarms caused by short-term problems. This value is controlled by the "Time to Alarm" field in the "Setup" window, as described in section 3.7.1 on page 28.
SMSOnRxTimeout=bool
This property takes an boolean argument (i.e. 0 for false or 1 for true) which specifies whether an SMS message should be issued (or not) when a channel's receive time-out reaches zero, as described in section 3.5.3 on page 23. This value is controlled by the "SMS On Rx Timeout" field in the "Setup" window, as described in section 3.7.1 on page 28.
SMSto=string
This property can be left blank or set to a comma-separated list of one or more telephone numbers. These are the numbers to which SMS messages are sent, if so configured, when an alarm is raised. The exact format of each number depends on the requirements of your SMS gateway. The list is configured via the "Setup" window, as described in section 3.7.3 on page 29.
ComPort=n
If you use an SMS modem or cellular 'phone to transmit SMS messages, this property should be set to the number of the COM port to which the SMS modem is attached, e.g. enter 7. to specify COM7. If you do not use an SMS modem, this field should be set zero ('0'). This property is configured via the "Setup" window, as described in section 3.5.3 on page 23.
OOHstart=time
This property should be set to a string specifying the time in the format hh:mm:ss (e.g. 22:00:00). It controls the start of the period recognised as "out-of-hours" for the purposes of raising alarms. The list is configured via the "Setup" window, as described in section 3.5.3 on page 23. The "out-of-hours" feature is described in section 3.5.2 on page 23.
OOHend=time
This property should be set to a string specifying the time in the format hh:mm:ss (e.g. 07:30:00). It controls the end of the period recognised as "out-of-hours" for the purposes of raising alarms. The list is configured via the "Setup" window, as described in section 3.5.3 on page 23. The "out-of-hours" feature is described in section 3.5.2 on page 23.
OOHthreshold=n
This property should be set to an integer (e.g. 5). It specifies the number of alarms which must be raised during the defined "out-of-hours" period before an SMS message is issued. The "out-of-hours" feature is described in section 3.5.2 on page 23.
LogTimeLag=bool
This property takes an boolean argument (i.e. 0 for false or 1 for true) which specifies whether the "Time lag from PC clock" data (see section 3.3.2 on page 12) are recorded to the file-system or not. It is configured via the "Log Time Lag" item on the "Actions" menu (see section 3.3.4 on page 16). The data are stored in .CSV files - see section 4.2 on page 38 for details.
RxPort=n
This property must be set to an integer between 1025 and 65535. It specifies the TCP port on which ArrayMon listens for incoming data. It is configured via a control on the main screen. See section 3.1 on page 7 for more information.
DefaultMute=bool
This property takes an boolean argument (i.e. 0 for false or 1 for true) which specifies whether audible alarms are muted when the ArrayMon program is first started. If set to false ('0'), audible alarms will not be muted.
WindowPos=x y w h
This property takes as an argument a list of four, space-separated integers (e.g. 400 360 1200 768) which specify the location (x and y coordinates) and size (width and height) of the main window. It is set automatically when you move or resize the window.
Rateunit=n
This property takes an argument which must be either 1 or 2. This controls the calculation of the "Serial bytes/sec" / "Network bytes/sec" value which is graphed on the main screen (see section 3.3.2 on page 12). ArrayMon sees the data packets forwarded to it by Scream! but it attempts to graph the network traffic coming in to Scream!. To do this accurately, it needs to know the transport protocol used for the incoming link, so that it can calculate correctly the associated protocol overhead. Set this property to 1 if the incoming link uses the BRP protocol (e.g. a serial link or a 6TD sending data over Ethernet); set it to 2 if the incoming link uses the scream protocol (e.g. from a NAM or another copy of Scream!).
If this property is set to 1, the graph legend on the main screen is "Serial bytes/sec". If it is set to 2, the legend is ""Network bytes/sec".
3.8.3 Trend
The "Trend" section of arraymon.ini is introduced by the line:
[Trend]
Below this, the following lines may be present
WindowPos=x y w h
This property takes as an argument a list of four, space-separated integers (for example, 400 360 1200 768) which specify the location (x and y coordinates) and size (width and height) of the "Channel Trends" window. It is set automatically when you move or resize the window.
AvPoints=n
This property takes an integer argument (e.g. 12) which controls the smoothing in the "Channel Trends" window. It specifies the number of data points over which an average is taken before the curves are plotted. It is set by a control in the "Channel Trends" window. See section 3.4 on page 17 for further details.
DaysHistory=n
This property takes an integer argument (e.g. 30) which controls the time period covered by the "Trend" window. It is set by a control in the "Channel Trends" window. See section 3.4 on page 17 for further details.
ListWidth=n
This property takes an integer argument (e.g. 100) which controls the width of the Channels list in the the "Channel Trends" window. It is set automatically when you drag the border between the list and the graph. See section 3.4 on page 17 for further details.