Chapter 4. File reference
A running copy of ArrayMon comprises several files, described in this chapter.
4.1 File location(s)
If you have write permission on the installation folder, all of these files will be in the same folder.
4.1.1 Windows Virtual Store
If you do not have write permission on the installation folder, all files except arraymon.exe will be automatically moved into the Windows Virtual Store. Consult your Windows documentation for more information or see the Microsoft Technet article at http://technet.microsoft.com/en-us/magazine/2007.06.uac.aspx.
Note: If the configuration and operation files are moved to the Virtual Store and multiple users log in to the same PC, different users will then have different configurations and they will not be able to see trend information recorded while another user was logged in. Because of this, use of the Virtual Store is satisfactory only if ArrayMon is used by one single Windows login user.
Files moved to the Virtual Store have identical paths to their original homes but, instead of starting from the root folder of the volume, "\", they start from the folder %localappdata%\virtualstore\ where %localappdata% is expanded by the operating system to a user-specific location.
For example, if arraymon.exe was installed into
C:\MyStuff\ArrayMon
and you do not have write permission on this folder, then you should expect to find the configuration file at
%localappdata%\virtualstore\MyStuff\arraymon\arraymon.ini
4.2 The files
The following files should be found in the installation directory or Virtual Store:
arraymon.exe
The executable program file itself.
arraymon.ini
The configuration file. See section 3.8 on page 30 for details about this file.
title.trend
This file stores the data used to plot the cross-array average curve in the "Channel Trends" window (see section 3.4 on page 17). The base-name of the file, title, is the instance title as set in the configuration file (see section 3.8 on page 30).
*.trend
These files store the data used to plot the curves in the "Channel Trends" window (see section 3.4 on page 17). There is one file for each configured channel and the display name of the channel is used for the base-name of the file. For example, trend data for a channel with a display name of RED01 will be stored in a file named RED01.trend.
Note: ArrayMon never deletes these files - even if the channel definition is removed from the configuration file - and the "Channel Trends" window displays data from every .trend file it that finds when it is opened. Because of this, unwanted test data (for example) may appear in the "Channel Trends" window. To remove an unwanted channel from the window, therefore, it is necessary to delete the associated .trend file.
The log_YYYY folders

these folders store operational logging information for the ArrayMon application. One such folder folder is created each year and, in the folder's name, YYYY is populated with the year so, for example, the folder log_2019 would contain the log-files for the year 2019.
These folders contain files that store alarm logging and system debugging information. The files have names like arraymon_YYYYMMDD.log where YYYY is populated with the year, MM with the month number (counting from one) and DD with the day-of-month number (again counting from one) so, for example, the file arraymon_20190110.log would store data for the 10th of January, 2019.
The files contain lines recording notable events: alarms or system operating problems. Each line is prefixed by a date and time specification in the ISO8601 format YYYYMMDDThhmmss where YYYY, MM and DD are as defined above, hh, mm and ss represent hours, minutes and seconds respectively and the separating 'T' is the literal ASCII character 'T'.
Possible entries include
Socket Error on RecvFrom n
An error occurred when waiting to read a UDP data packet. The system error number is given as n. Consult your operating system documentation for information about interpreting this error number.
Rx Timeout on name
No packets were received from the channel with display name name for the configured time-out period. See section 3.5.3 on page 23 for further information.
Rx Resumed on name
Additional packets have been received from the channel with display name name since an Rx Timeout alarm was issued for that channel.
Voltage low on name
The reported supply voltage for the channel with display name name is lower than the configured threshold. See section 3.5.4 on page 24 for further information.
Voltage recovered on name
The reported supply voltage for the channel with display name name has risen above the configured threshold (after previously having fallen below and causing an alarm condition).
Cancelled: message
An alarm condition, identified by message, was raised but the condition cleared itself before the time-out had expired. No SMS messages relating to this alarm will be sent.
ALARM:name:n%
The signal from a channel, identified by name, has deviated from the array-wide average by a percentage, given as n%, which exceeds the configured alarm threshold. See section 3.5.5 on page 24 for further information.
Send Msg to number: "message"
An SMS message containing message has been sent to telephone number number.
Generated test message
The operator requested a test SMS message using the "Generate test SMS" item on the "Actions" menu.
latency_YYYY-MM-DD.csv
these files are created if the system is configured to log the time lag between the incoming data packets and the PC's clock (see section 3.3.2 on page 12, section 3.3.4 on page 16 and section 3.8.2 on page 33). One file is created each day and, in the filename, YYYY is populated with the year, MM with the month number (counting from one) and DD with the day-of-month number (again counting from one) so, for example, the file latency_2019-01-10.csv would store data for the 10th of January, 2019.
Each file contains two comma-separated columns. The first contains the sample data and time in the format YYYY-MM-DD hh:mm:ss where YYYY, MM and DD are as defined in the filename and hh, mm and ss represent hours, minutes and seconds respectively. The second column contains the latency figures in units of milliseconds, given to three decimal places. - i.e. microsecond precision. One line is added every ten seconds. A typical file contains data like
2019/01/10 00:00:04, 2.784
2019/01/10 00:00:14, 18.952
2019/01/10 00:00:24, 28.956
2019/01/10 00:00:34, 21.640
⋮
which, when imported into Microsoft Excel, looks like
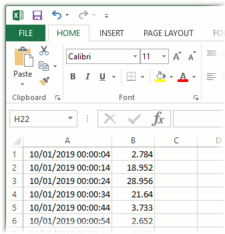
(Dates and times may be presented differently, depending on your PC's configuration and regional settings.)