Chapter 6. Calibration
The Fortis is supplied with a comprehensive calibration document and it should not normally be necessary to calibrate it yourself. However, you may want to check that the response and output signal levels of the sensor are consistent with the values given in the calibration document.
6.1 Absolute calibration
The sensor's response (in V/ms-2) is measured at the production stage by tilting the sensor through 90 ° and measuring the acceleration due to gravity. In addition, sensors are subjected to the “wagon wheel” test, where they are slowly rotated about a horizontal axis. The output of the sensor traces out a sinusoid over time, which is calibrated at the factory to range smoothly from 1 g to –1 g without clipping.
6.2 Relative calibration
The response of the sensor, together with several other variables, is measured at the factory. The values obtained are documented on the sensor's calibration sheet. Using these, you can convert directly from voltage (or counts, as measured in Scream!) to acceleration values and back. You can check any of these values by performing calibration experiments.
Güralp sensors and digitisers are calibrated in the following way:

In this diagram, a Güralp digitiser is being used to inject a calibration signal into the sensor. This can be either a sine wave, a step function or broad-band noise, depending on your requirements. As well as going to the sensor, the calibration signal is returned to the digitiser.
The signal injected into the sensor gives rise to an equivalent acceleration, which is added to the measured acceleration to provide the sensor output. Because the injection circuitry can be a source of noise, a “Calibration enable” line from the digitiser is provided, which disconnects the calibration circuit when it is not required. The Calibration Enable line must normally be allowed to float high. To enable calibration, the Calibration Enable line should be connected to ground.
Note: Instruments can be supplied where this logic is reversed. This is known as “active-high” logic. For active-high instruments, the Calibration Enable line should normally be grounded and only allowed to float high during calibrations.
Fortis instruments are tuned at the factory to produce -1 V of output for +1 V input on the calibration channel. For example, a Fortis with gain set to unity (4 g full-scale) has an acceleration response of 0.25 V/ms-2 so it should produce -1 V output given a 1 V calibration signal (i.e. polarity-reversed), corresponding to 1/0.25 = 4 ms-2 = 0.408 g of equivalent acceleration.
6.3 Calibrating the Fortis
Both the DM24 digitiser and Scream! software allow direct configuration and control of any attached Güralp instruments. For full information on how to use a DM24 series digitiser, please see its own documentation.
6.3.1 Broadband Noise calibration using Scream and CD24/DM24 digitiser.
To calibrate using Scream! and a Güralp CD24 or DM24 digitiser:
In Scream!'s main window, right-click on the digitiser's icon and select Control… In the resulting dialogue, select the Calibration tab.
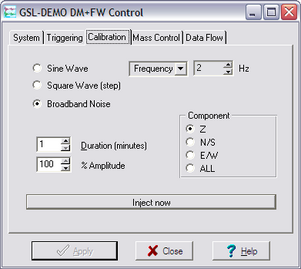
Select “Broadband Noise” as the calibration type and, under Component, select “Z”. This will calibrate all three components simultaneously.
Note: The Fortis has a single Calibration Line for all three components. Choices other than 'Z' will have undesired results.
Make any other choices you require and click Inject now. A new data stream, ending Cn (where n is an integer in the range 0 – 7) or MB, should appear in Scream!'s main window. This contains the returned calibration signal.
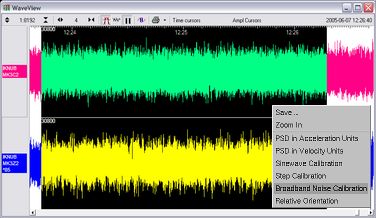
Open a WaveView window on the calibration signal and the returned streams by selecting them and double-clicking. The streams should display the calibration signal combined with the sensors’ own measurements. If you cannot see the calibration signal, zoom into the WaveView using the scaling icons at the top left of the window or the cursor keys. If necessary, drag the calibration stream Cn up the WaveView window, so that it is at the top.
If the returning signal is saturated, retry using a calibration signal with lower amplitude, until the entire curve is visible in the WaveView window.
If you need to scale one, but not another, of the traces, right-click on the trace and select Scale…. You can then type in a suitable scale factor for that trace.
Pause the WaveView window by clicking on the

Hold down the SHIFT key (

The script will ask you to fill in sensor calibration parameters for each component you have selected.
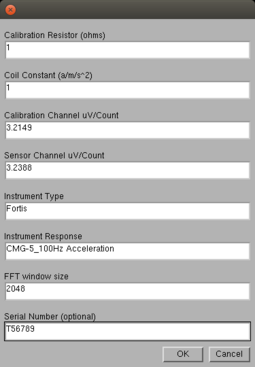
Fill in the form as follows:
“Calibration Resistor” should be set to 1
“Coil Constant” should be set to 1
The “Calibration Channel” sensitivity can be found on the calibration sheet for your digitiser.
The “Sensor Channel” sensitivity for the appropriate axis can be found on the calibration sheet for your digitiser.
“Instrument Type” should be set to “Fortis”.
“Instrument response” should be set to CMG-5_100Hz Acceleration
The Number of FFTs is calculated automatically and need not normally be overwritten.
The serial number can be filled in if desired: it is printed on the resulting graph.
Click

The noise calibration script automatically performs appropriate averaging to reduce the effects of aliasing and cultural noise.


The duration should be long enough to capture many periods of the lowest-frequency signal of interest. As a guide, allow one minute for each second of the lowest frequency for which you want accurate results. If, for instance, you are analysing signals with a period of 30 seconds, calibrate for at least half an hour.
If you prefer, you can inject your own signals into the system at any point (together with a Calibration enable signal, if required) to provide independent measurements and to check that the voltages around the calibration loop are consistent. For reference, a DM24-series digitiser will generate a calibration signal of around 16,000 counts (4 V) when set to 100% (sine-wave or step) and around 10,000 counts (2.5 V) when set to 50%.
6.3.2 Broadband Noise calibration using Affinity digitiser.
To calibrate using an Affinity digitiser:
In Affinity web-page, go to Control → Instruments and select the Calibration tab.
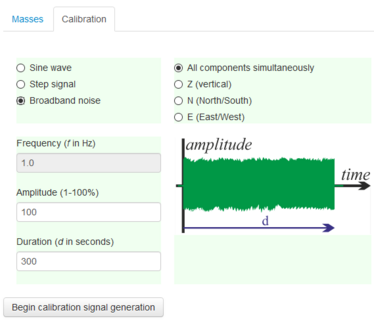
Select “Broadband noise” as the calibration type and, under Component, select “Z”. This will calibrate all three components simultaneously.
Note: The Fortis has a single Calibration Line for all three components. Choices other than 'Z' will have undesired results.
Make any other choices you require (amplitude, and duration) and click Inject now. A new data stream, ending Cn (where n is an integer in the range 0 – 7) or MB, should appear in Scream!'s main window. This contains the returned calibration signal.
In Scream, open a WaveView window on the calibration signal and the returned streams by selecting them and double-clicking. The streams should display the calibration signal combined with the sensors’ own measurements. If you cannot see the calibration signal, zoom into the WaveView using the scaling icons at the top left of the window or the cursor keys. If necessary, drag the calibration stream Cn up the WaveView window, so that it is at the top.
If the returning signal is saturated, retry using a calibration signal with lower amplitude, until the entire curve is visible in the WaveView window.
If you need to scale one, but not another, of the traces, right-click on the trace and select Scale…. You can then type in a suitable scale factor for that trace.
Pause the WaveView window by clicking on the
Hold down the SHIFT key (
The script will ask you to fill in sensor calibration parameters for each component you have selected.
Fill in the form as follows:
“Calibration Resistor” should be set to 1
“Coil Constant” should be set to 1
The “Calibration Channel” sensitivity can be found on the calibration sheet for your digitiser.
The “Sensor Channel” sensitivity for the appropriate axis can be found on the calibration sheet for your digitiser.
“Instrument Type” should be set to “Fortis”.
“Instrument response” should be set to CMG-5_100Hz Acceleration
The Number of FFTs is calculated automatically and need not normally be overwritten.
The serial number can be filled in if desired: it is printed on the resulting graph.
Click
The noise calibration script automatically performs appropriate averaging to reduce the effects of aliasing and cultural noise.

The duration should be long enough to capture many periods of the lowest-frequency signal of interest. As a guide, allow one minute for each second of the lowest frequency for which you want accurate results. If, for instance, you are analysing signals with a period of 30 seconds, calibrate for at least half an hour.
6.3.3 White Noise calibration using Minimus
To calibrate using a Minimus digitiser:
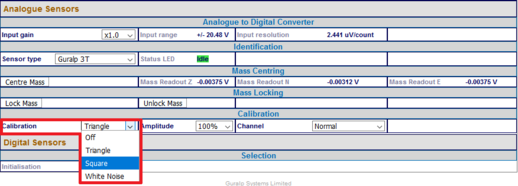
Go to the Setup tab of the web page and use the drop-down menu to choose White Noise signal to be injected into the sensor's feedback loop.
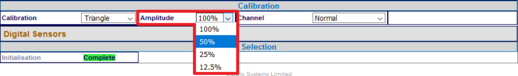
Adjust the calibration signal amplitude at 100%, 50%, 25% or 12.5% of the DAC full range.
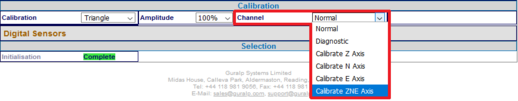
Finally, enable the calibration on all three components of the Fortis.
Note: The calibration channel, named nACCC0, produces an output if and only if the calibration is in progress.
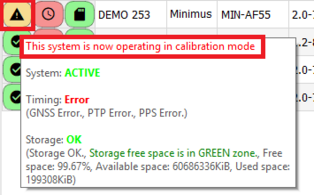
While the calibration is in progress, the web-page shows the warning message

In Scream, open a WaveView window on the calibration signal and the returned streams by selecting them and double-clicking. The streams should display the calibration signal combined with the sensors’ own measurements. If you cannot see the calibration signal, zoom into the WaveView using the scaling icons at the top left of the window or the cursor keys. If necessary, drag the calibration stream nACCC0 up the WaveView window, so that it is at the top.
If the returning signal is saturated, retry using a calibration signal with lower amplitude, until the entire curve is visible in the WaveView window.
If you need to scale one, but not another, of the traces, right-click on the trace and select Scale…. You can then type in a suitable scale factor for that trace.
Pause the WaveView window by clicking on the
Hold down the SHIFT key (
The script will ask you to fill in sensor calibration parameters for each component you have selected.
Fill in the form as follows:
“Calibration Resistor” should be set to 1
“Coil Constant” should be set to 1
The “Calibration Channel” sensitivity can be found on the calibration sheet for your digitiser.
The “Sensor Channel” sensitivity for the appropriate axis can be found on the calibration sheet for your digitiser.
“Instrument Type” should be set to “Fortis”.
“Instrument response” should be set to CMG-5_100Hz Acceleration
The Number of FFTs is calculated automatically and need not normally be overwritten.
The serial number can be filled in if desired: it is printed on the resulting graph.
Click
The noise calibration script automatically performs appropriate averaging to reduce the effects of aliasing and cultural noise.
The duration should be long enough to capture many periods of the lowest-frequency signal of interest. As a guide, allow one minute for each second of the lowest frequency for which you want accurate results. If, for instance, you are analysing signals with a period of thirty seconds, calibrate for at least half an hour.


6.3.4 Calibration with third-party digitisers
The Fotis and FortisPH can be calibrated when a third-party digitiser is being used.
To calibrate a Fortis: Connect the calibration enable line, pin R, to ground, pin N. Apply a calibration signal of around ±2.5 V between pins P and N.
To calibrate a FortisPH: Connect the calibration enable line, pin R, to logic ground, pin Y. Apply a calibration signal of around ±2.5 V between pins P and N.
Some third-party digitisers can be programmed to make the necessary connections
6.4 The calibration pack
All Güralp sensors are fully calibrated before they leave the factory. Both absolute and relative calibration calculations are carried out. The results are given in the calibration pack supplied with each instrument.
6.4.1 The calibration sheet
The calibration sheet provides the measured acceleration output over the flat portion of the sensor frequency response in units of volts per metre per second squared (V/ms-2). Because the sensor produces outputs in differential form (also known as push-pull or balanced output), the signal received from the instrument by a recording system with a differential input will be twice the true value. For example, the calibration sheet may give the acceleration response as “2 x 0.50 V/ms-2”, indicating that this factor of 2 was not included in the value given.
Caution: Never ground any of the differential outputs. If you are connecting to a single-input recording system, you should use the signal ground line as the return line and ignore the inverting output.
6.4.2 Frequency response
The poles and zeroes table describes the frequency response of the sensor. If required, you can use the poles and zeroes to derive the true ground motion mathematically from the signal received at the sensor. The Fortis is designed to provide a flat response (to within 3dB) over its passband.
Güralp Systems performs frequency response tests on every sensor at the time of manufacture. All records are archived for future reference. The results of these tests are provided with the sensor.
When testing the instrument to confirm that it meets its design specification, the range of frequencies used are concentrated over about 3 decades (i.e. 1000 : 1) of excitation frequencies. Consequently, the frequency plots of each component are provided in normalised form. Each plot marks the frequency cut-off value (often quoted as “‑3dB” or “half-power” point).
6.4.3 Obtaining copies of the calibration pack
We keep a copy of all calibration data that we send out. In the event that the calibration information becomes separated from the instrument, you can obtain all the information using our free email service. Simply email caldoc@guralp.com with the serial number of the instrument in the subject line.
For example:

The server will reply with the calibration documentation in Word format. The body of your email will be ignored. If you need multiple documents, enter all the serial numbers in the subject line, separated with spaces and/or commas.