
Chapter 8. Supplementary windows
Aside from the Main Window, WaveView windows and Network control window, Scream! includes facilities for monitoring status streams, the status of your network, the integrity of incoming data, and for accessing the serial consoles of attached DM24 and CD24 digitisers.
8.1 Terminal windows
Scream! provides a terminal emulator that can be used over both serial lines and networks. It can open a network terminal session with any connected CD24 or DM24 digitiser. Over a serial link, it can, In addition, open a session to the command line of an EAM if the server permits it: see Chapter 7.
8.1.1 Communicating with instruments
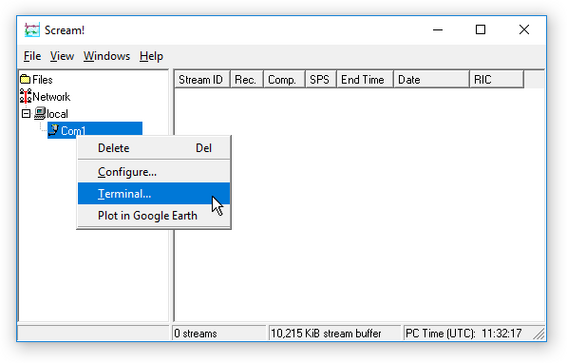
To open a terminal session with an instrument, right-click on its entry in the left pane of Scream's Main Window and choose Terminal… from the pop-up menu:
Scream! automatically negotiates with any other Güralp devices or software in the chain until it reaches the one you want to contact, and then attempts to place the target digitiser in command mode. If this fails, press 

If you see an ok prompt, as shown below, the digitiser is ready to receive commands. Otherwise, press 
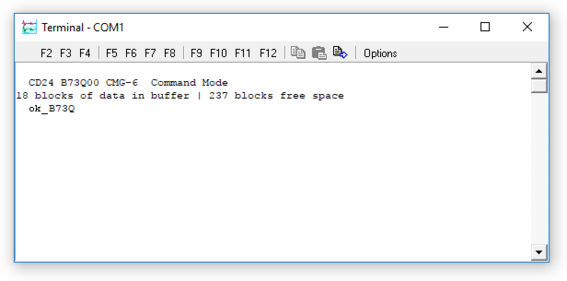
The 


To begin capturing a session, including every command you type as well as the instrument's response, right-click in the Terminal window and select Capture to File…. All subsequent actions will be saved to a file with name that you enter, combined with a unique source string. Capturing stays in effect through digitiser restarts and, also, if you close Scream! and restart it later. The capture file's name is displayed in the caption of the Terminal window.
To send a file to a digitiser, right-click in the Terminal window and select Send File…. In Windows, you can also drag-and-drop a file. This can be used to read in lists of commands that you have prepared; for example, to set up a number of digitisers identically. It is also used to update a digitiser's firmware.
Note: For details on how to set up firmware transfers, refer to the documentation for the relevant digitiser.
To close the connection, close the Terminal window. Scream! will automatically instruct the digitiser to start transmitting data. If the digitiser begins transmitting data whilst the Terminal window is still open (e.g. because you have issued the close or go command, or because of a time-out), the window will close automatically with the message Terminal session closed by instrument.
8.1.2 Macro commands
The Terminal window provides icons for the keys 

You can enter these commands by
left-clicking one of the Fn icons in the Terminal window,
pressing the corresponding function key whilst the Terminal is open, or
right-clicking on the digitiser's entry in Scream!'s Main Window, and selecting the command from the drop-down menu. Scream! will automatically start a terminal session with the instrument, send the command and then close the link.
Scream! remembers all of your macro settings when you close the program.
8.1.3 Direct connections
You can also open a terminal session directly to your computer's serial ports or over a network. This is useful for communicating directly with modems, or with the consoles of third-party equipment.
To do this, select File → Terminal… from Scream's main menu:
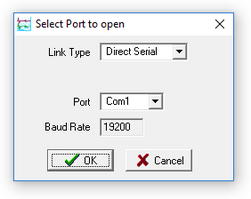
The Select Port to open window is displayed.
To make a serial connection, choose Direct Serial as the Link Type, select the name of the serial port you want to use, and check that it has the expected baud rate. If it does not, you can change it in the Setup window (see section 4.1). Click

Scream! servers can provide access to their own serial ports over the network. To connect to the serial port of a remote Scream! server, choose Remote Serial and fill in the IP address of the remote computer, together with the port name or number. Click

You will need to enable serial access on the Scream! server to use this feature:
If it is another instance of Scream!, open the My Server tab of the Network Control window in that instance and tick Allow remote access to Com ports.
If your Scream! server is a Güralp NAM or EAM, you will need to ensure that the Disable terminal access check-box is not ticked in the gcf-out-scream server configuration dialogue.
This option is most useful for accessing serial ports on a remote computer which is not producing GCF data. If a remote port does emit GCF data, it will appear in the source tree as normal, and you can open a session with it by right-clicking and selecting Terminal….
To connect over a TCP/IP terminal link, either to a remote Scream! server or to a TCP terminal device (e.g. a serial to network converter), choose TCP/IP and fill in the IP address of the remote computer. Click

The terminal window will then open as described above.
8.2 Digitiser status streams
Most Güralp digitisers have a separate stream for reporting information about the system, such as their GNSS and time synchronization status. This status information is in plain ASCII text format.
To see a Status window for any digitiser, double-click on the Stream ID which ends with two zeros: xxxx00. This stream always has a reported sample rate of 0 samples per second.
During boot-up, each unit reports its model type, firmware revision number, its System ID and its serial number via this stream. This information is followed by the number of resets that have occurred and the time of the latest reboot from its internal clock. The following lines report the current configuration of the unit's sample rates, output taps, and baud rates.
A typical digitiser re-boot status message looks like this:
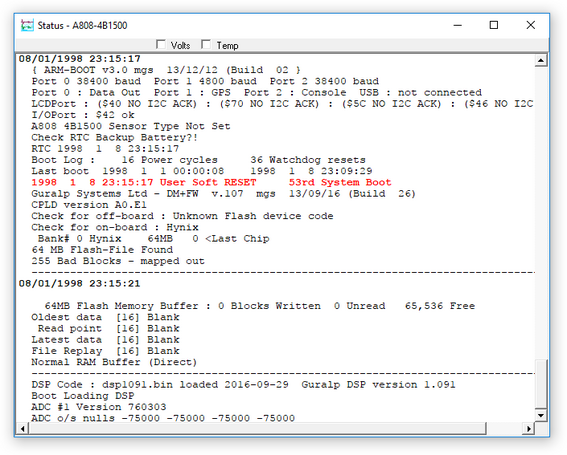
The system will produce a similar status message whenever it is powered up and whenever you reboot it (for example, after changing its configuration).
Various status messages will be highlighted in red or green depending on the importance of the message (e.g. the “System Boot” message above). The right-click context menu offers a Custom highlighting... option that allows user-definable key words or phrases to cause a status line containing that phrase to be highlighted red or green, depending on the list into which it is entered.
8.2.1 GNSS
GNSS is the general term for a Global Navigation Satellite System. It can refer to one or more of GPS, GLONASS, Galileo, Beidou etc. In this document, the term GNSS is also used to refer to the receiver module that is connected to the digitiser.
If a GNSS receiver is connected to the digitiser, its operational status is reported on reboot and the behaviour of the time synchronisation software will also be shown.
From a cold start, the GNSS receiver will initially report No GPS time together with its last position (taken from the internal backup). All messages from the GNSS that involve a change of its status are automatically reported. Some digitisers will suppress small changes in reception strength once a 3D fix has been obtained.
A typical GNSS status report from a DM24 digitiser looks like this:
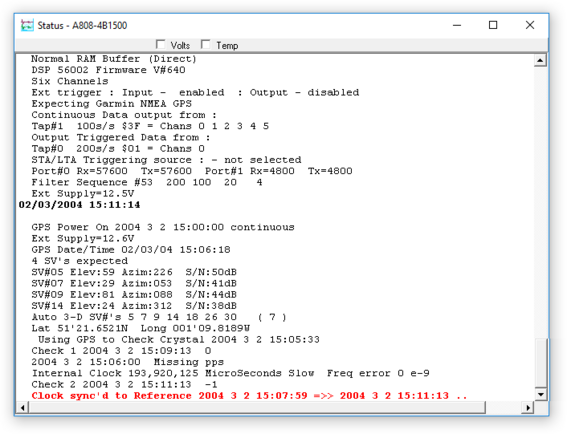
This report shows which satellites (officially: Space Vehicles, abbreviated to SVs) the system has found, along with their corresponding signal strengths.
If the system has not been moved from its previous location, it should be able to find enough satellites to obtain an accurate time fairly quickly; if the GNSS receiver has difficulty finding satellites, there may be a delay of several minutes before a new message is displayed.
Before beginning to synchronise, the digitiser's internal clock management software will wait for the GNSS receiver to report a good position fix from at least three satellites, for at least six consecutive messages. Messages are normally received every 10 to 20 seconds.
The system will then set the internal clock and re-synchronise the Analogue to Digital Converters so that all subsequent data are accurately time-stamped to the new reference.
Note: Any data transmitted up to this point will have been stamped with the time from the internal, battery-powered backup clock, which can be significantly inaccurate if the digitiser has been powered down for a long time.
The re-synchronisation will result in a discontinuity in the data received. If you are viewing the data in a WaveView window and the status stream is also being received and block markers are enabled, the resynchronisation will be marked in the WaveView window with the 
From this point, the control process in the digitiser will attempt to keep the internal time-base synchronised to the GNSS' 1 pulse-per-second (PPS) output, by adjusting a voltage-controlled crystal oscillator. First it alters the voltage control to minimise the error. Next it attempts to minimise both the “phase error” (i.e. the offset between the internal 1 Hz signal and the GNSS) and the drift (the frequency error relative to GNSS, which is the first derivative of the phase error). During the control process, the system reports the measured errors and the control signal applied as the PWM (Pulse Width Modulation) value.
During the initial, coarse adjustment stage, only the coarse voltage control is used and no drift calculation is made. If the system is operating in a similar environment to that when the system was last powered (most importantly, the same temperature), the saved control parameters will be appropriate and the system should rapidly switch to the ‘fine’ control mode. The system reports its control status and parameters each minute, with error measurements given in nominal timebase units. In a stable temperature environment, the system should soon settle down and show an offset (error) of only a few thousand (average error < 100 microseconds) and a drift rate of under a hundred counts (< 1 in 10-6).
8.2.2 Graphing status information
Most Güralp digitisers transmit a status block every few minutes, giving information about the GNSS status, internal temperature etc:
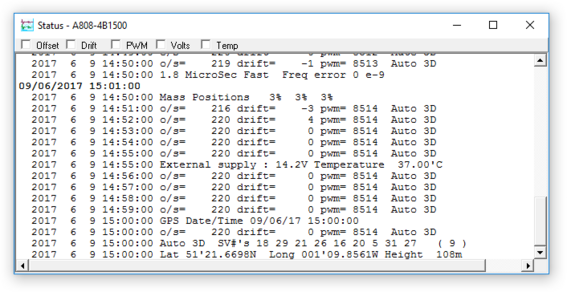
Scream! can automatically extract measurements from these messages and show them in graphical form. For each plotable field that Scream! finds, amcheck-box is displayed at the top of the Status window. In the example above, Scream! has found Offset, Drift, PWM, Volts (i.e. DC input) and Temp (temperature) fields in the status messages. Not all digitisers output all of these fields, so some of these check-boxes may not be present in all windows.
Note: Scream determines that a field is present only once it has seen the relevant value appear in the status stream. It may be many minutes before a given parameter, such as Temperature, appears. Scream will not offer the ability to graph such a value until it has appeared at least twice.
To display any or all of these fields in graphical form, tick the check-box(es) for the field(s) you want to examine:
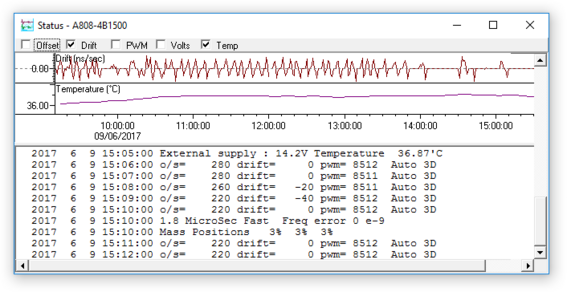
You can resize the Status window, or drag the bar between the graphs and the block display area, to see the graphs in more detail.
8.2.3 Station Lat/Long
Some digitisers will periodically report the Latitude and Longitude of the GNSS receiver coordinates in the status information. For example
2017 6 14 09:00:00 Lat 51'21.6718N Long 001'09.8555W Height 113m
When detected, Scream will parse these lines, and update an internal record of instrument location.
Scream can use this location information in several ways:
It can generate google maps references for single stations, and launch Google Maps in a web browser. In the The source tree, right-click on an instrument, and select Plot in Google Maps.
It can generate .kml files for arrays or networks, and launch in the Google Earth application. In the The source tree, right-click on Network or a server, and select Plot in Google Earth.
The WaveView Context menu also contains location-based options, such as stream-sorting and axis-spacing. See section 6.1.8 for details.
The location information is stored in the calvals data. Entries are automatically created with the name aPos1=. A number of fields in this entry record the details of the location, as follows:
Field | Meaning |
1 | Averaged latitude |
2 | Averaged longitude |
3 | Averaged height |
4 | Number of points received at this location |
5 | Date/time of first report at this location, in ISO8601 format |
6 | Date/time of most recent report at this location, in ISO8601 format |
When a new Latitude/Longitude report is detected in the status, it is compared to the current, known position. If within a small range (default 250 metres), it is assumed that the receiver has not moved so the location is added to the averaged position and the most recent time is updated. In this way, the longer the station runs for, the more readings are averaged, and the more precise the stored location becomes.
However, if the new position is out of this range, the instrument is assumed to have moved, so a new location is started with an incrementing aPos entry (e.g. aPos2= then aPos3= etc). In this way, a history is built up of where and when a particular sensor has been. This can be useful for portable arrays and seismic surveys, where equipment moves regularly.
In some circumstances, GNSS receiver location is not available, or not accurate (e.g. time source is not a GNSS, or is centrally distributed to an array over a large area). To override the automatic position, a manual position entry - mPos=… - can be entered in the format shown:
mPos1=51.3132 -1.2243 160.7132
Only fields one, two and three - latitude, longitude and height - are specified in this case.
8.3 The summary window
This window provides at-a-glance state of health information about all instruments on your network. To open it, choose Windows → Summary window from Scream!'s Main Window.
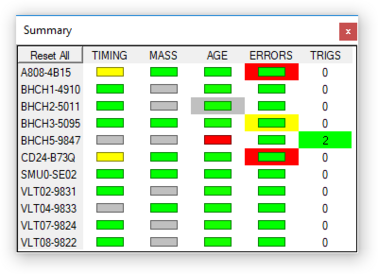
Every instrument known to Scream! is listed in this window, with coloured icons representing their timing, mass position and data flow status. The window also reports how many triggers have been communicated to Scream! in status blocks.
To make Scream! forget this information and start afresh, click 
In the leftmost four columns, each entry is a coloured rectangle with a border. A grey rectangle indicates that no relevant data have been received from the instrument since Scream! was started. Green indicates that this measurement is satisfactory; yellow indicates that some attention may be necessary, and red indicates that there is probably a problem.
If a box has a coloured border, an unsatisfactory reading has been received since the last reset, but the status has since improved. Thus, if a box goes from yellow to green, the border will be coloured yellow until you reset. If the same box subsequently turns red momentarily and then returns to yellow or green, the border will change to red.
8.3.1 Timing
This column details the instrument's GNSS timing status. The colours are the same as those used for the top half of the instrument's icon in the Main Window. Double-click on a column entry to see the status messages coming from that instrument.
Grey : Scream! has not received any GNSS information from the instrument since the last reset.
Green : The instrument has reported a satisfactory GNSS timing fix.
Yellow : The instrument has reported a gap in the timing stream. This may occur if the GNSS signal deteriorates to the point where the receiver cannot keep a lock on the satellites.
Red : The instrument has not reported a satisfactory timing fix for over an hour. This will happen if there have been gaps in the signal (as above), but also if it has not reported anything. If you have set the GNSS system to power down for intervals longer than an hour, the icon will turn red even if the system is working normally.
8.3.2 Mass position
This column indicates the instrument's mass position status. To open a WaveView window showing the instrument's mass position channels, double-click on the column entry.
The status is obtained by comparing the mass positions to the threshold set in the EMail tab of the Setup window - see section 13.2 for details.
Grey : Scream! has not received any mass positions information from the instrument since the last reset.
Green : The instrument has reported satisfactory mass positions (all components less than 50% of the specified threshold).
Yellow : One or more components are reporting mass positions between 50% and 100% of the threshold. Most instrument types will still function normally, but the noise level will increase and the masses should be re-centred at the first convenient opportunity.
Red : One or more components are reporting mass positions over the configured threshold. Most instrument types may still function adequately, but the masses should be re-centred as a matter of urgency.
8.3.3 Age
This column records the time that the instrument last sent data to Scream!.
When a data block is received, the box turns green. Over the next two minutes, if no more data are received, the box gradually changes through shades of yellow, to orange, and finally red.
If more than two minutes pass before the next data block is received, the border of the box will change to red to alert you that a suspicious gap in data has been detected. If you do not expect real-time data from this instrument, or you are using low sample rates exclusively, you may allow this column to turn red. For example, a one sample per second stream will transmit a block only once every four minutes under quiet conditions.
Double-click on a column entry to select the instrument in Scream!'s Main Window.
8.3.4 Errors
This column records the number of corrupted blocks that Scream! has received. A corrupted block is one whose checksum does not match the data, or which fails one of Scream!'s integrity checks. To see which checks are failing:
Open a ViewInfo window on the suspect stream, where erroneous values are shown in red (see section 2.1.4).
Alternatively, double-click on the column entry to open the error log file (if you are recording one) in Notepad or an xterm.
The meaning of the colours is as follows:
Green : Fewer than two corrupted data blocks have been received in the last minute, or the window was reset less than a minute ago.
Yellow : between two and ten corrupted data blocks have been received in the last minute.
Red : More than ten corrupted data blocks have been received in the last minute.
8.3.5 Triggers
This column records the number of times the digitiser has sent a trigger status message since Scream! was started. New triggers are coloured in green; when you Reset window, the green shading will disappear, but the number will remain.
Double-clicking on a column entry opens a window with details of the trigger events:
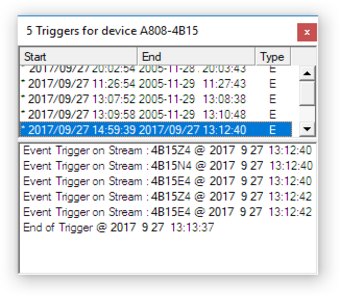
The top half of the window lists all the trigger events, with information extracted from each trigger's status message. The full status message is reported in the lower half.
Double-clicking on an entry in the table (or selecting it and pressing 
If you have instructed the digitiser to record pre- or post-trigger data, Scream! will attempt to include these as well. If two triggers from the same digitiser overlap, Scream! may show both triggers in the WaveView window, because the point where one trigger ends and the next begins is essentially arbitrary.
Scream! can only display data which is still in its stream buffer. If the buffer is full and the data have already been purged, double-clicking on a trigger will show a blank window. To view the data, you will need to retrieve it from the hard disk or your recording system and replay it into Scream!.
The columns contain the following information:
Start : The start time of the trigger, prefixed with a * if the trigger occurred since the last time you reset the Summary window.
End : The end time of the trigger.
Type : What caused the trigger: R if the STA/LTA ratio exceeded the set threshold, L if the level exceeded the threshold, E for an external trigger (if the digitiser supports it) or S for a manual trigger (generated in software).
You can also open the Triggers window by right-clicking on a digitiser's entry in the Main Window and selecting Triggers… from the menu.
8.4 The ViewInfo window
Detailed header information from incoming data blocks is available from the ViewInfo window, accessible by selecting Windows → Info Display… from Scream!'s Main Window.
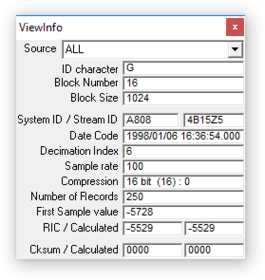
If ALL is selected as the Source at the top of this window, details of every incoming data block will be shown as they arrive. You can narrow the selection to a particular source using the drop-down menu.
Scream! makes a number of validity checks for incoming blocks. Any suspect fields are shown in red in the ViewInfo window.
When analysing data received over BRP (i.e. from all serially connected digitisers and network-connected CD24s), the first three fields and the final Checksum (Cksum) come from the transport header, which is added to each GCF block to aid with data transmission. When analysing data received over the network using the Scream! protocol, these values are synthesised.
The displayed fields are:
Block ID character : Must be a G for GCF format blocks.
Block Number : An incrementing counter, modulo 256 (i.e. 255 + 1 = 0) for blocks from a data source. This box reports the Block Number for every incoming block, so this value will not update sequentially if you are using several sources. Unless the field turns red, the value is what Scream! expected.
Block Size : The size, in bytes, of the GCF block following, not including transport information.
The remaining fields constitute the information available from the GCF block's internal header and mostly duplicate the information available in the stream list. The following additional information is available:
Decimation Index : This byte, otherwise known as the Tap Table Lookup value, or TTL, provides information about the filter-chain configuration of the digitiser, among other things. When the byte is non-zero (legacy digitisers did not populate this field), Scream! will interpret it if it can, and display the corresponding filter set-up. For more details, please see the Support→FAQs section of our web-site.
Sample Rate and Compression : The current sample rate and compression code, also displayed in Scream!'s Main Window.
Number of Records : GCF blocks are divided into four-byte records. Each record can contain one, two or four samples, depending on the current compression factor. Since all GCF blocks are 1024 bytes long, allowing for the 24-byte header, a full GCF block should always contain at least 250 records. However, it is permissible for a GCF block to be only partially full. In particular, for 200 sps data, the requirement that block boundaries be at integer seconds means that the GCF packets will contain 200, 400 or 1000 samples.
RIC / Calculated : The Reverse Integrating Constant (effectively the value of the last sample in the block) and its calculated value from the differences in the block.
Checksum / Calculated : Received and calculated checksum values for the data in the block. If these differ, Scream! assumes the data are corrupt and asks the digitiser to re-transmit the corrupt block. If you are using a simplex communications link, this will fail and the data block will be lost.
Scream! also logs any errors that it detects. For more information on Scream!'s logging system, see Chapter 13.