

Summary
Carbon storage technologies, such as carbon injection into depleted oil and gas reservoirs, are recognised as important tools in the race to limit climate change emissions whilst alternative sources of energy are developed and established.
One of the risks associated with carbon injection is the potential for triggered seismicity in the region of the injection activity. Background seismicity monitoring of the proposed storage site is an important step in understanding the level of potential risk inherent in the geology of the area as well as for designing an effective monitoring methodology once injection activity is underway.
With planned large-scale carbon storage projects due to commence in the Horda Platform Region, offshore Norway in 2024, Equinor in partnership with NORSAR and others, undertook the HNET project (https://hordanet.no/) to assess the potential for seismic hazard in the area.
Due to the offshore location, an improved event detection capability of the existing Norwegian National Seismic Networks (NNSN) was envisioned to provide even better background seismic data. A key objective for the project team was to explore cost effective methods. By demonstrating that lower detection thresholds could be achieved with lower cost land-based arrays tuned for offshore monitoring, carbon storage projects become more economically viable.To increase the azimuthal coverage and thereby, detection and location capability for the offshore area, the project team proposed a small nine-element onshore array on the island of Holsnøy, (HolsNøy ARray - HNAR) located to the East of the Horda platform.

Güralp Instrumentation
3T-120
With its lightweight and portable design the weak-motion 3T-120 PH (posthole) instrument is suitable for temporary and permanent deployment in vaults or postholes. For its’ size the 3T-120 PH has great sensitivity with 1500 V/msˉ¹ (2 x 750 V/msˉ¹) differential standard output and also has a low self-noise level of 166 s (0.006 Hz) to 10 Hz. Due to the proximity of the HNAR array to the coast, the project team selected the Güralp 3T-120 PH (posthole) seismometer as it was suitable for sub-surface installation.
The 3T-120 PH can be partnered with the Affinity or Minimus digitisers. Each offers a flexible array of features and functionality that you can tailor according to the needs of the project and both utilize precision time protocol for absolute timing accuracy.
The Affinity digitiser
The Affinity is a certified IMS digitiser offering authentication capabilities.
The Affinity delivers high-quality digitisation with 31-bit resolution. Designed for data quality and durability, the Affinity is a stable and robust Linux-powered unit with on-board storage and networking facilities.
 The 3T-120 posthole seismometer shown alongside a Minimus+ digitiser")
Figure 2: (left) The 3T-120 posthole seismometer shown alongside a Minimus+ digitiser

Figure 3: Affintiy digitiser
Deployment of the HNAR array
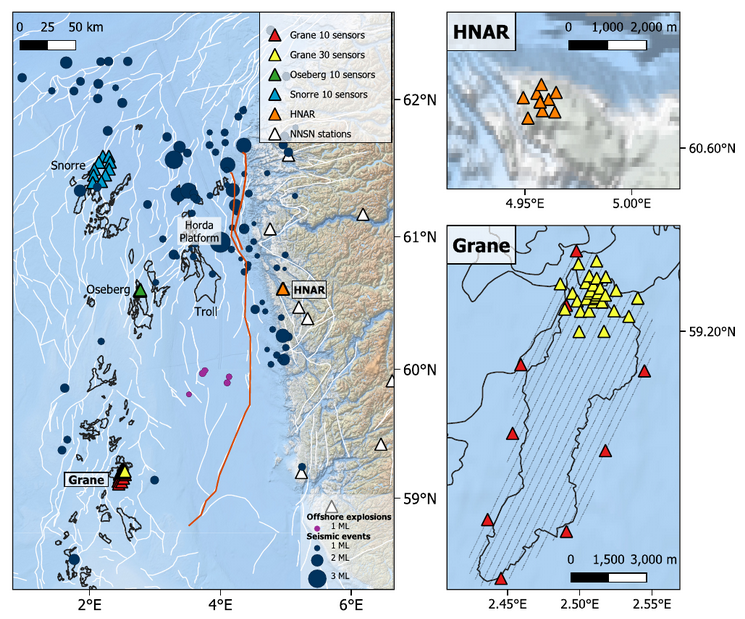
In May 2020, the nine-element HNAR seismic array (HolsNøy ARray) was deployed on Holsnøy, an island on the west coast of southern Norway (Fig. x). Due to their proximity to the coast, the 3T-120 PH sensors are deployed in shallow posthole sites to mitigate against ambient noise. The stations are arranged in two concentric rings around a central site, forming an array of about 1 km aperture.
Despite being located close to the open sea with continuous ocean-swell related seismic vibrations, noise amplitudes on all HNAR sensors are close to the average global noise model, which makes the array well suited for seismic monitoring. As expected, more frequent and longer episodes of higher noise levels occurred during autumn and winter months due to the seasonal increase in storm activity and the proximity to the coast.
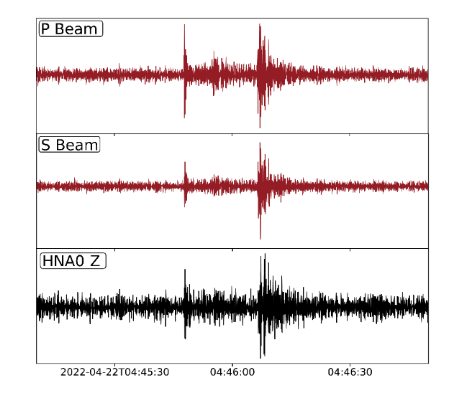
The HNAR array has improved the seismic event monitoring in the target area by (1) lowering the event detection threshold through beamforming and correlation detectors; (2) providing initial locations from back azimuth and SP-wave arrival-time difference without additional observations at other stations, thus allowing for automatic selection of potential events of interest in the Horda platform region; and (3) improving the event location capability using back-azimuth measurements for events.
The use of array processing techniques with HNAR has improved Signal to Noise Ratio (SNR), allowing for previously undetectable events to be detected. This helps to improve overall event location accuracy thereby improving hazard assessment of the target area.
")
Figure 4 and 5: Left hand panel: Seismic events in the North Sea detected by the HNAR array and located with HNAR and NNSN stations between 23.05.2020 and 19.03.2021. The seismic events are represented by the dark blue circles and the event magnitude is proportional to the symbol size. The purple symbols denote offshore explosions conducted by the Norwegian navy. The boundaries of oil and gas fields in the region are plotted with black lines, the major faults with white lines and the Øygarden fault zone with the orange line. The HNAR station is depicted with the orange triangle. Right hand panel: Array geometry of HNAR sensors. (Jerkins et al. 2022)
Outcome
The HNAR array has improved the seismic event monitoring in the target area by (1) lowering the event detection threshold through beamforming and correlation detectors; (2) providing initial locations from back azimuth and SP-wave arrival-time difference without additional observations at other stations, thus allowing for automatic selection of potential events of interest in the Horda platform region; and (3) improving the event location capability using back-azimuth measurements for events.
The use of array processing techniques with HNAR has improved Signal to Noise Ratio (SNR), allowing for previously undetectable events to be detected. This helps to improve overall event location accuracy thereby improving hazard assessment of the target area.
")