Chapter 4. Viewing data with Scream!
You can use Güralp Systems' Scream! software to view incoming seismic data, record it, and play events back later. Windows and Linux versions of Scream! are freely available from Güralp Systems.
4.1 The main window
When you start Scream!, you will be shown an empty main window:

Scream! is now ready for you to start adding data sources.
4.2 Serial ports
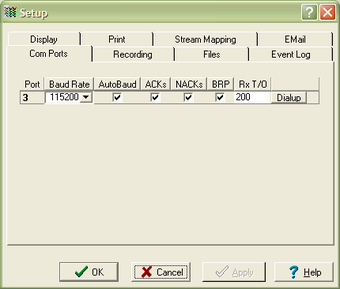
Select File → Setup…. If the Com Ports tab is not visible, bring it to the front.
If you are running Scream! for the first time, it will automatically bring up this window, together with a short tutorial.
You can also configure a serial port by right-clicking on its entry in the streams list (the left-hand panel in the main window) and selecting Configure… However, you can only do this if data has already arrived through the port, making it appear in the streams list.
The serial ports available to Scream! are listed in the table. Identify each port, and the instrument connected to it.
If you are using Microsoft Windows, the Port number corresponds to the COMn number of the serial port.
If you are using Linux, Port numbers 1 – 64 refer to the built-in serial ports /dev/ttyS0 – /dev/ttyS63, and 65 and above to USB-connected serial ports beginning /dev/ttyUSB0.
A port may not be listed if it is not installed, or suitable drivers are not available, or if another program is using it. Scream! scans your computer for new ports each time you open the Setup window. To make Scream! scan the ports again, click the Port column heading.
Configure each port according to the settings of the instruments connected to them:
Baud Rate : The speed of the serial link to the instrument. If you do not know the baud rate of your digitizer's output port, select Auto-Detect from the drop-down menu to have Scream! attempt to detect it for you. The instrument must be producing data for this to work.
You can set all ports to the same baud rate by clicking on the column heading and choosing a suitable value from the drop-down menu.
Under normal conditions, you will not need to change any of the remaining settings.
Click OK.

Streams from connected instruments should now begin appearing in the right-hand portion of Scream's main window.
Scream! will remember all the data sources you have specified on exit. When you next open the program, it will automatically try to re-establish all the connections.
4.3 The stream buffer
Scream! works by recording incoming streams into a fixed area of memory, called the stream buffer. All of Scream!'s operations work with the data in this buffer.
When you start Scream! for the first time, this buffer is empty. You can add data to it either by receiving it from local serial ports, connecting to Scream! network servers, or replaying GCF files.
Once the stream buffer is full, Scream! will start discarding the oldest data. If you have not told Scream! to record the incoming streams (see chapter 5), then you will not be able to get discarded data back.
If you have enabled GCF recording, Scream! keeps track of the files which contain data in the stream buffer, and saves this information in a .lst file in the current recording directory. When Scream! is restarted, it reads this file and tries to rebuild the stream buffer as it was when it was shut down. Otherwise, the buffer starts off empty as before.
4.4 The source tree
The tree in the left panel of the main window shows all the data sources currently connected to Scream!.

Scream!'s source tree has two main parts: Files, which contains all the files you have replayed (including automatic replay: see section 5.3), and Network, which represents your seismic network.
Beneath Network is a list of all the network servers Scream! is connected to, plus the entry Local for your computer's own serial ports.
The next layer contains the serial ports themselves. These icons are provided to help you identify the instruments, as well as providing direct terminal access.
You can tell Scream! to ignore a particular instrument by right-clicking on its icon and selecting Ignore. When you do this, Scream! will discard any blocks it receives from the instrument. They will not appear in the stream buffer or be recorded to disk. Select Ignore again to stop ignoring the instrument.
4.4.1 Icons
Instrument icons change colour to provide you with a quick overview of the instrument's timing and mass position status:
If both halves of the instrument icon are clear 
If the top half is green 
If the top half is yellow 
If the top half is red 
If the bottom half is red 
If the instrument appears as a green box 
4.5 The stream list
If Network is selected in the source tree, the right-hand panel will list all the data streams which Scream! receives (and is not ignoring). If an entry in the source tree is selected, the stream list will only show the streams beneath that entry—selecting a serial port will only show streams from instruments connected to that port, and so on.
The columns in the table provide useful information about each stream.
Stream ID : A unique name for the data stream, being a combination of six letters A – Z and numbers 0 – 9. Streams ending in 00 carry status information about the internal digitizer, whilst other streams contain data coming from connected instruments. The slow-rate environmental channels (Mux channels) generally have Stream IDs ending in Mx where x is a hexadecimal digit (0 – 9 or A – F), whilst other Stream IDs are used for seismic data from attached instruments.
The last number in the Stream ID gives the tap number of the stream: in order of decreasing sample rate, 0, 2, 4, or 6. If you are using a 6-channel digitizer, tap numbers 1, 3, 5 and 7 are used for the second 3 channels.
Rec. : Whether Scream! is currently recording the data stream to the laptop's onboard hard disk. If another device on your network is recording the data stream independently of Scream!, the entry in this column will still be No.
Comp. : The compression factor of the data in the stream, expressed as the number of bits occupied by each record (8, 16 or 32 bits.)
SPS : The sampling rate of the data stream, in samples per second. Status streams, ending in 00, do not constantly output data and have an SPS of 0. By default, the stream list is sorted in order of sample rate, with the status streams at the bottom.
End time and Date : the date and time of the most recent data, as measured by the data's own timestamp. This is not necessarily the latest data to arrive.
RIC : The ‘Reverse Integrating Constant’. In effect this is the value of the last sample received. This is most useful for reading mass positions or other environmental streams. Status streams have a RIC of zero.
You can hide the extended information about each stream by selecting View → List from the menu. To return to the full view, select View → Details.
4.5.1 Sorting options
Sorting options are available from the View → Sort By → menu:
Alphabetical : Strict alphabetical order, 0 – 9 then A(a) – Z(z).
Component : Vertical components (ending Zx), followed by Nx and Ex components, then Mux channels Mx. Within a component type, sort by the first four characters of the Stream ID.
Instrument : Sort by the first four characters of the Stream ID. Within an instrument, sort by tap, then by component.
Sample Rate : Sort by sample rate, highest to lowest. Within a sample rate, sort as Instrument.
Tap : Sort by tap (the last character of the Stream ID). Within a tap, sort by instrument, then by component.
Select the Reversed option to reverse any of these sort orders.
You can also sort the list by Stream ID or SPS by clicking on the relevant heading; click again to reverse the sort order.
4.6 Waveview windows
The most commonly used features of Scream! are accessed through Waveview windows. You can open as many Waveview windows as you like, on any combination of streams; the same stream can be part of several Waveview windows at once, at several different scales.

To open a Waveview window from Scream!'s main window:
select Window → New Waveview Window… from the main menu;
double-click on a stream ID in the streams list;
right-click on a stream in the list and select View; or
make a selection of streams and double-click the selection (or press ENTER.)
You can add further streams to the Waveview window by selecting them from the streams list and dragging the selection into the Waveview window, or by dragging them from other Waveview windows. Dragging with Ctrl held down will copy the stream from one window to another; otherwise, the stream will be moved to the new window.
You can also drag streams within a Waveview window to reorder them. (If you have paused a Waveview window with the 
To the left of the stream display is a panel identifying the stream by its System ID and Stream ID. If the label is too long to read, you can resize the panel by dragging its edge across the Waveview window. You can also hide the panel this way.
Above the stream display is a toolbar, containing icons which act on all of the streams within the window.
4.6.1 Zooming in and out
To zoom in and out vertically, click the vertical scale icons 
To zoom in and out horizontally, click the horizontal scale icons 
If you have a large window which takes some time to scroll, especially at a high horizontal zoom factor, Scream! may not be able to finish drawing new data before it needs to scroll again. If this happens, Scream! will delay scrolling until it can display in real time once more. To prevent this, decrease the time scale.
If you have paused the window with the
4.6.2 Making measurements
Click the Time Cursors or Ampl Cursors button to display a pair of vertical or horizontal cursors. Each cursor has a white square at one end, which can be dragged across the Waveview window to measure features. If two cursors coincide, you will only be able to see the squares.

The distance between the cursors is given in the text of the Time Cursors or Ampl Cursors icon, in seconds and Hz or counts. You can have both vertical and horizontal cursors active at the same time. Because the limit of accuracy of the cursors is one pixel, you should zoom in to the range of interest before measuring.
The Ampl Cursors measure distances in counts according to the current zoom settings. However, if you have applied a scaling factor to an individual stream (see below), the Ampl Cursors do not take this scaling into account. If you set a stream's scale factor to the combined sensitivities of the sensor and digitizer, you can set up the window so that one pixel corresponds to a useful value in physical units.
To obtain the true value in counts, divide the value displayed in the Ampl Cursors icon by the scale factor for that stream, as displayed beneath its ID on the left-hand panel.
4.6.3 Printing
To print the data currently being displayed in the Waveview window, click on the Print icon 
To print the same data in black and white (on a colour or greyscale printer), click on the arrow beside the Print icon and select Page Print (monochrome) from the drop-down menu. Black and white output is more suitable for copying or faxing.
4.6.4 Paused mode
Click the Pause icon
Whilst a window is paused, you can:
Scroll the waveform to left and right to view all the data that Scream! has in memory. Alternatively, hold down CTRL whilst turning your mouse wheel to scroll through the data. Because new data is still being added to the memory buffer, the scroll bar will move slowly to the left as long as the display is paused.
Zoom in and out to examine features in the data.
Select data from several streams by holding down SHIFT and dragging:
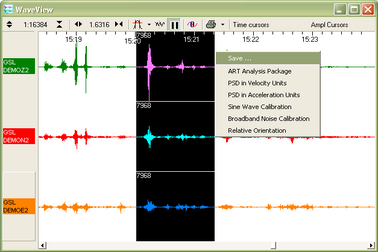
You can save this data to a file by clicking Save…:
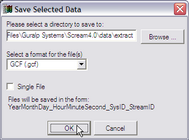
Select the directory and format for the file, and click OK to save the data with one file for each stream (using the format shown.)
Some formats support multiple streams per file. For these formats, you can select Single File to combine the streams.
The number at the top left of the selection (here, 2940) is the number of samples from each stream that you have selected.


Click the Pause icon again to return to real-time mode. If you have changed the zoom settings, the window will return to its previous state, with the window once more following the real-time data.
4.6.5 Other icons
Click the Block Boundaries icon 
The number beside each line is the number of bits used to store each sample in the block. A fixed-length GCF block with 8-bit samples (largest difference –128 to 127 counts) can store 4 times as many samples as a block using 32 bits for each one (largest difference –4 294 967 296 to 4 294 967 295 counts). Clicking the icon again removes the block markers.
Click the Bandpass Filter icon 
Data at 1 or 2 samples/s is filtered with a 10 – 30 s pass band.
Data at other sample rates is filtered with corner frequencies at 0.1 and 0.9 times the Nyquist frequency of the stream; for example, the pass band for the filter applied to a stream at 100 samples/s will be 5 – 45 Hz.
Click again to remove the filter.
Click the Zero Streams icon 
4.7 Viewing status streams
Status streams (ending 00) consist of plain text. Double-clicking on a status stream produces the Status window:

The first blocks will give the boot message from the digitizer, including its software revision and the data streams selected for downloading and triggering. Later blocks give information on visible GPS satellites, the location of the GPS antenna and time synchronization status. Also displayed are the baud rates currently used for each channel and for the data link.
If you View a selection which includes both status and data streams, the status streams will be collected together and displayed in a tabbed Status window, whilst the data streams will appear in a single Waveview window.