Chapter 14. Monitoring Operations
This chapter details how to monitor and control the acquisition module. Some functionality is only available from the command line (when connected via a serial cable or via SSH over the network - see section 3.2.5 for details on how to do this) and other features are only available via the web interface. This chapter will describe both.
14.1 Diagnostics and the Summary screen
14.1.1 System Status
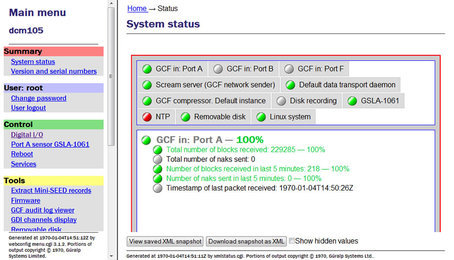
To view the overall system status click on the “Home” link in the breadcrumb trail or the “System status” link in the main menu.
The top part of the status screen is a tabbed list of devices connected to the acquisition module. Clicking on a tab will display a status report for that device.
The system has predefined warning and error levels which are displayed as coloured dots and are defined as:
Green:
 Level is 70% or above – system OK
Amber:
 Level is below 70% - system warning
Red:
 Level is below 40% - system error/malfunction
Grey:
 There is no status information.
14.1.2 System Log
The most important source of diagnostic and debugging information is the system log facility (“syslog”). This logs all messages from programs and from the Linux kernel. At present, this can only be viewed from the command line.
To view the system logs, you can use the tail, less, grep or vi commands to inspect the file /var/log/messages - older files are available as /var/log/messages.1, /var/log/messages.2 etc.
Use the following syntax to view the files:
tail /var/log/messages
Views the last few entries.tail -f /var/log/messages
As above but, after printing the last ten lines of the file, continues to run, printing each new line as it is added to the log. Type +
+ to stop the output and return to the command line.
less /var/log/messages
Views the whole log file; use the ,
,  ,
,  and
and  keys to navigate and the
  key to exit.
vi /var/log/messages
Those users familiar with the vi text editor may wish to use it as the most powerful way to view log entries.grep -i 'string' /var/log/messages
Searches for a string or pattern in the log file. This search is case insensitive (-i flag).
grep is a very powerful tool for searching for patterns. For more information, see the section on Regular Expressions in the grep manual page at http://man-wiki.net/index.php/1:grep
14.1.3 Incoming Data
The status web-page has one box for each GCF acquisition process. This box will be updated every minute to reflect the number of packets that have been acquired.
To view details of incoming GCF format data using the command line, enter the command gdi-top. This will displays real-time information about each packet arriving, until interrupted by the operator typing .
14.1.4 Software build number
The “Software build number”, as displayed on the “Linux system” tab of the status screen, may be useful for your own records or when requesting technical support. See section 5.2 for more details.
14.2 Warning and error monitoring
In addition to the status indicators listed in section 14.1.1, the status of all components can be monitored and, if the level falls below a set percentage, a selected output line can be switched from low to high for use by an external indication system.
To configure the status iolines using the web interface select:
Configuration → All options → Status iolines assertion configuration
To configure the status iolines from the command line, start gconfig and select “Status iolines assertion configuration” from the top level menu.
14.2.1 Configurable parameters in simple mode
The configurable parameters for recording data in simple mode are shown below:
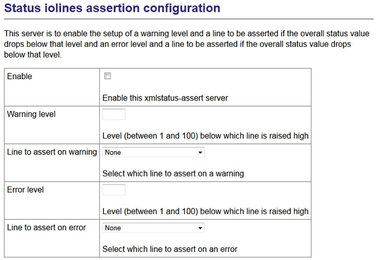
Enable: Activates the assertion server.
Warning level: Set the level at which the warning signal is to be triggered.
Line to assert on warning: Select the output line from the drop-down list. All output lines are displayed so care should be taken to choose a suitable output line.
Error level: Set the level at which the warning signal is to be triggered. The error level must be less than the warning level.
Line to assert on error: Select the output line from the drop-down list. All output lines are displayed so care should be taken to choose a suitable output line.
14.2.2 Configurable parameters in expert mode
An additional field is displayed in expert mode:
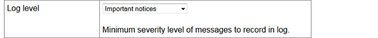
Log level: The drop-down menu controls the level of detail present in log messages. Not all of the standard syslog logging levels are available. The menu offers a choice (in order of decreasing detail) of:
Debugging information
Informational messages
Important notices
Warnings
14.3 The Control Menu
The “Control” menu of the web interface is a dynamic menu with content that changes depending on the which devices are attached. Two items on this menu are always present: “Reboot” and “Services”. CMG-NAM units fitted with RAID arrays will also have a “RAID array services” menu item. Other items will appear as required, depending on both the underlying hardware and attached devices.
14.3.1 Digital I/O (p ower control and anti-tamper monitoring)
The acquisition module hardware can be fitted with optional sensors to monitor and switch the voltages and currents being supplied to the CMG-EAM and also to devices connected to the CMG-EAM ports, such as digitisers. A program on the CMG-EAM runs constantly in the background and monitors the sensors if they are fitted. The same program can monitor the anti-tampering lines, where fitted.
To control the Digital I/O from the web interface, select:
Control → Digital I/O
The screen displays the current digital I/O status for each monitored line.
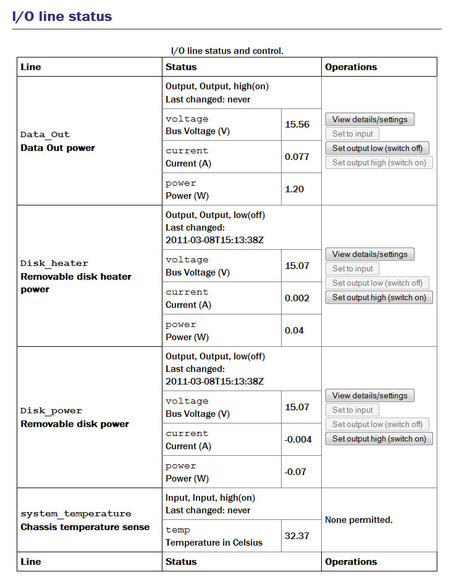
Clicking the “View details/settings” button produces the following screen:
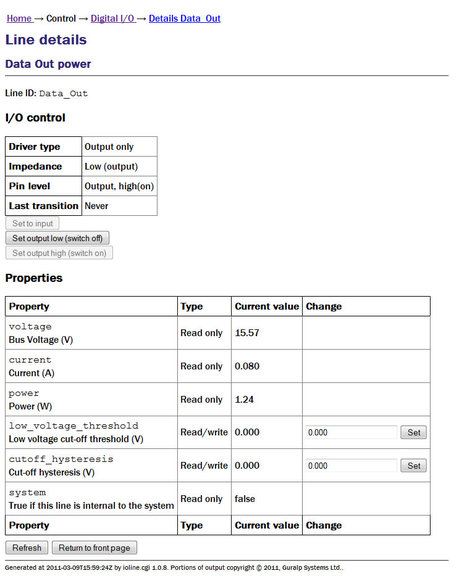
The first part of the page duplicates the information shown on the main screen. The remainder of the page provides a more detailed report.
Note: The user must be in the 'Peripheral control (gpio)' group to make any changes. All other users will only be able to view the settings.
Low voltage cut-off threshold: It is possible to protect attached devices from under-voltages by setting a value. If the monitored voltage falls below this value, it is automatically turned off.
Cut-off hysteresis: To prevent rapid, repeated power-cycling of attached devices, a hysteresis value should be set. The monitored voltage must rise above the sum of the threshold voltage and the hysteresis voltage before the supply will be re-enabled.
Click the “Return to front page” button to display the main Digital I/O summary again.
14.3.2 Digitiser/Sensor Control
The acquisition module allows control of attached digitisers and sensors. To configure digitisers, see section 8.
Note: Support for “active high” sensors: Control of sensors is implemented using logic lines in the cable between the sensor and the digitiser, one for each function (lock, unlock, centre, etc). Standard Güralp sensors use “active low” logic, which means that the logic lines are normally floating at +5V with respect to the logic ground (the sensors have a pull-up resistor and the digitiser presents a high impedance). When a particular function is to be activated, the digitiser grounds the relevant logic line, triggering the appropriate action at the sensor.
Some special-order Güralp sensors use “active high” logic, where the lines are normally grounded and allowed (not driven) to float high in order to trigger the associated control function. CMG-DM24SxEAM units can be configured to support active high instruments by connecting pins V and Y of the SENSOR-A connector using a special cable. These cables can be ordered from GSL (as “active high sensor cables for DM24SxEAM”) or manufactured by modifying standard GSL sensor cables.
Sensors can be controlled via the web interface or the command-line, The web interface is simpler and requires no detailed knowledge of the attached devices. The command line interface is more powerful but requires detailed knowledge of the digitiser's command line interface and the manual for the digitiser in question should be referred to for further details.
14.3.2.1 Instrument Control - Web interface
The main menu of the web interface adapts to include additional options when the system detects attached digitisers and/or digital sensors.
Extra items in the “Control” menu are associated with digitiser serial numbers. If a digitiser has two sensors attached to it, it is recommended that an extra serial number be added to the digitiser. See section 8.3 (or the relevant digitiser manual) for information on how to configure this.
The sensors are listed in the following format:
Port A instrument C914-3K55
and indicate the physical connection (Port A) to the attached device, the device type (instrument) and its serial number (C194-3K55). If the instrument is connected via TCP, the EAM connection is shown as host:port.
Note: If using a DM24 MkIII seven-channel digitiser, there is no control over the second sensor (Sensor B). Any attempt to control the second sensor will act on Sensor A.
Selecting a device takes you to the “Instrument Control” page. From here, one can query mass positions, lock, unlock and centre the sensor masses and perform calibration functions.
The form is long and is displayed here in sections:
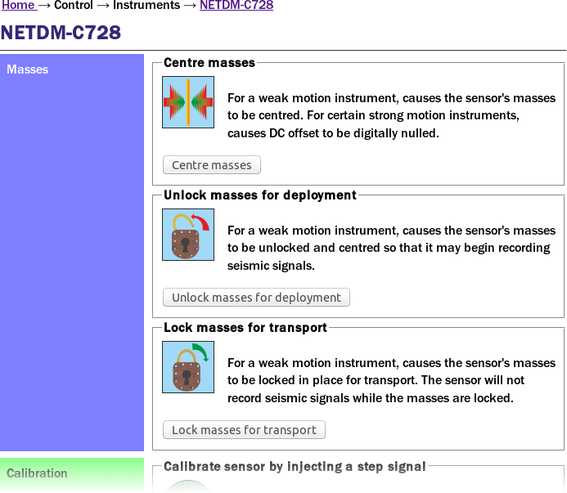
The first part of the screen offers controls to centre, unlock and lock the instrument's masses.
Note: These controls invoke the appropriate digitiser commands. An indication of success means that the digitiser has accepted the command but does not imply that it has executed correctly.
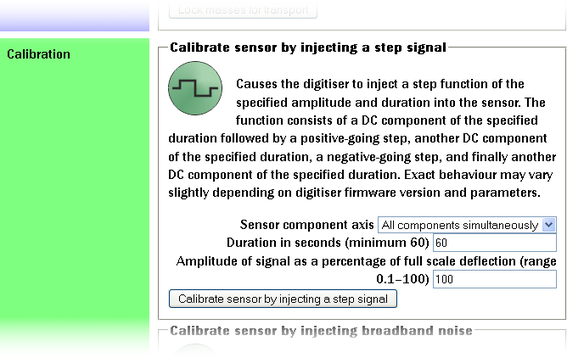
The next part of the screen provides controls to initiate calibration. The step-calibration section provides controls for selection of components, duration and amplitude. Not all instruments support calibration of individual components.
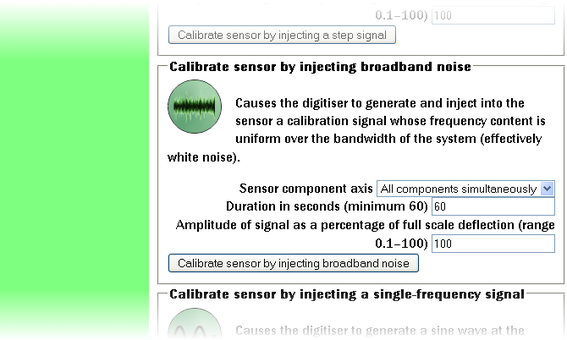
The broadband noise calibration section provides controls for selection of components, duration and amplitude. Not all instruments support calibration of individual components.
The sine-wave calibration section provides controls for selection of components, duration, amplitude and frequency. Not all instruments support calibration of individual components.
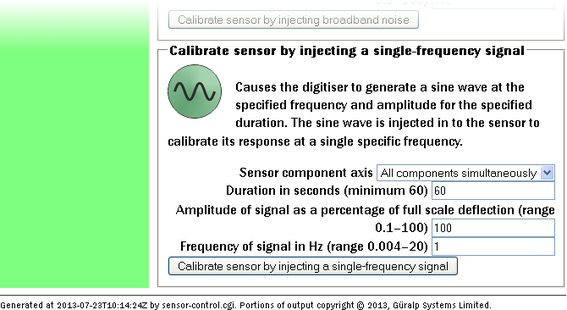
Note: The Amplitude value in all calibration dialogues refers to an arbitrary full-scale output from the calibration circuitry. It can be left at 100% unless clipping is observed, in which case it should be reduced until an undistorted output is observed.
14.3.2.2 Instrument Control - Command line
Platinum provides both a high-level and a low-level interface to connected digitisers. The low-level interface involves interacting directly with the command-line of the digitiser and is described at the end of this section.
The high-level interface is provided by the adc-command command, which takes a number of sub-commands as described below. Each command must be directed to a specific sensor and this must be specified as the first argument. When invoked with no arguments, or with the --help argument, a list of available targets (referred to as “modules”) is displayed:
eam2010 ~ # adc-command --help
usage: adc-command <module> <command> [options...]
======== Available ADC modules ========
C914-3K55
C914-3K56
This is followed by a list of available sub-commands. In the descriptions below, module should be replaced by a name from the list provided by invoking adc-command --help.
adc-command module mass-centre
Perform a centring operation on the sensor's masses. This sub-command takes no options.adc-command module mass-lock
Lock the masses for transportation. This sub-command takes no options.adc-command module mass-unlock
Unlock the masses for deployment. This sub-command takes no options.adc-command module calib-sine arguments
Perform a sine-wave calibration according to the specified arguments, which are given as a space-separated list of key=value pairs:component=[ ALL | Z | N/S | E/W ] - specify the component(s) to be calibrated
duration=m - specify the duration, in minutes, where m is an integer value. For accurate results, the duration should be significantly longer than the response time of the instrument.
amplitude=a - specify the amplitude, where a is the integer percentage of the full output of the calibration signal generator. This can normally be given as 100 but should be reduced if clipping is noticed.
freq=n - specify the frequency (in integer Hertz) or period (in integer seconds) of the calibration signal, according to the setting of...
freq_or_period=[ Hz | sec ] - specifies whether the value associated with freq is interpreted as Hertz or seconds.
adc-command module calib-step arguments
Perform a step calibration according to the specified arguments, which are given as a space-separated list of key=value pairs:component=[ ALL | Z | N/S | E/W ] - specify the component(s) to be calibrated
duration=m - specify the duration, in minutes, where m is an integer value. The calibration signal will first go negative for this duration, then back to zero for the same duration, then go positive for this duration, then return to zero again for the same duration. For accurate results, the duration should be significantly longer than the response time of the instrument.
amplitude=a - specify the amplitude, where a is the integer percentage of the full output of the calibration signal generator. This can normally be given as 100 but should be reduced if clipping is noticed.
adc-command module calib-noise arguments
Perform a broad-band noise calibration according to the specified arguments, which are given as a space-separated list of key=value pairs:component=[ ALL | Z | N/S | E/W ] - specify the component(s) to be calibrated
duration=m - specify the duration, in minutes, where m is an integer value. For accurate results, the duration should be significantly longer than the response time of the instrument.
amplitude=a - specify the amplitude, where a is the integer percentage of the full output of the calibration signal generator. This can normally be given as 100 but should be reduced if clipping is noticed.
The acquisition module also provides the ability to connect to the terminal of any connected Güralp digitisers in order to configure their operation and control the attached sensors. To do this, connect to the acquisition module terminal as in section 3.3 and run the “data-terminal” command.
eam999 ~ # data-terminal
Select the desired digitiser (using the and keys and Enter to select) from the list that is presented:
This will launch a minicom session (see section 16.3), allowing you to communicate with the digitiser terminal. For example:
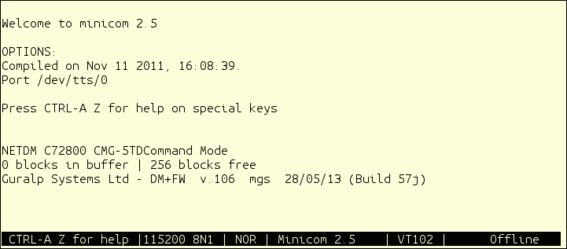
If the session closes due to a time-out (or you close it manually by issuing the GO command) then you will see the message Killed by signal 15 and minicom will exit shortly thereafter.
14.3.3 Upgrading digitiser firmware
The latest digitiser firmware for each type of digitiser is included in the Platinum distribution so no Internet connection is necessary for the following tasks. You may wish first to upgrade the Platinum firmware (see section 5), so as to be sure that you have the latest digitiser firmware available.
14.3.3.1 Upgrading via the web interface
To upgrade the firmware of a digitiser using the web interface select:
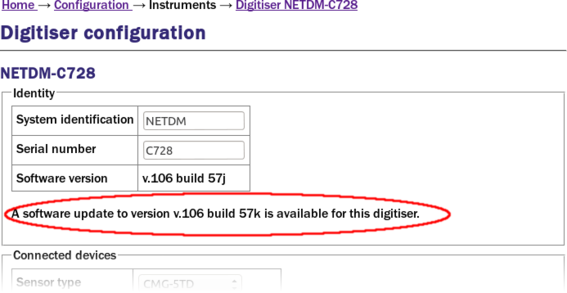
Configuration → Instruments → Port A instrument....
(or any other page under Configuration→Instruments). The system will check the version of the firmware currently loaded. If a newer version is available, an alert is displayed at the top of the page:
and a check-box is displayed at the bottom of the page:
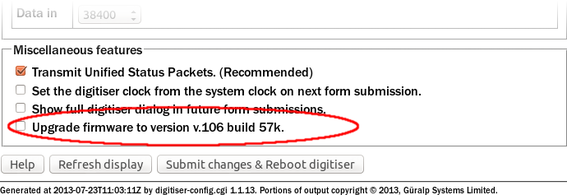
To upgrade, tick the check-box and click  .
.
14.3.3.2 Upgrading from the command line
The dm24-upgrade command can be used to update the firmware of attached DM24 and CD24 digitisers. When invoked without arguments, it displays a detailed usage message.
When invoked with the name of a port (e.g. Port A or PortA) as an argument, the command will identify the type of attached digitiser and the current firmware revision and will upgrade it if necessary. For example, the command
dm24-upgrade PortA
will upgrade the firmware of the digitiser attached to Port A of the acquisition module, if necessary. The latest digitiser firmware for each type of digitiser is included in the Platinum distribution so no Internet connection is necessary.
Note: The currently-loaded DSP firmware version is identified from the label that was entered when the firmware was last upgraded. Because this label is not checked, any text could have been entered, which may confuse the upgrade command. If this is the case, please use the –force option, described below, to over-ride the version checking.
For more advanced uses, the following options are available. Multiple options can be separated by spaces and the command should always end with a port specifier. This can be in the form Port A or PortA or /dev/ttyS0 (the Linux port name).
--trashfram
Performs a hard factory reset on a CMG-DM24 digitiser. Note that the values of all configuration parameters will be lost. Some of the following options allow basic reconfiguration following the reset.
--ids sys ser
A hard reset will normally erase the system ID and serial number of the digitiser. The dm24-upgrade command, when invoked with --trashfram, attempts to discover these values and reinstate them after the reset. This option allows you to specify new values for the system ID and serial number to be used instead of the discovered values. The argument sys specifies the new System ID to use and the argument ser specifies the serial number.
--samp # # # #
This argument allows you to specify new sample speeds to set for the decimation filter chain. This argument requires requires four numerical values to be supplied using the same format as for the SAMPLES/SEC command (described in the DM24 manual). For example, the command
dm24-upgrade --samp 1000 500 100 50 PortA
will set tap 0 to 1,000 samples per second and taps 1, 2 and 3 to 500, 100 and 50 samples per second respectively.
--cont # # # #
This option specifies which streams will be enabled for continuous output at each tap. This argument requires requires four numerical values to be supplied using the same format as for the CONTINUOUS command (described in the DM24 manual). For example, the command
dm24-upgrade --cont 1 0 0 7
will turn on continuous output of the vertical component at tap 0 and of the three triaxial components at tap 3
--trig # # # #
This option specifies which streams will be enabled for triggered output at each tap. This argument requires requires four numerical values to be supplied using the same format as for the TRIGGERED command (described in the DM24 manual).
--gps-baud #
This option takes a single numerical argument which specifies the Baud rate of the GPS port.
--in-baud #
This option takes a single numerical argument which specifies the Baud rate of the Data in port.
--upgrade
Upgrade firmware files only (this is the default).
--downgrade
This option over-rides internal version number checks, allowing firmware to be downgraded as well as upgraded.
--force
This option causes firmware files are to be loaded even if they appear identical to the versions already loaded, or in cases where the installed version number cannot be decoded.
--boot file
This option specifies an alternative source file for DM24 Mk3 bootstrap firmware. If not specified, the upgrade command will look in /usr/share/firmware/CMG-DM24mk3/ for files with names of the form dm24mk3-boot*.img and use the most recent version that it finds. It uses a lexical sort to determine which is the most recent. The argument file should be the path to a valid DM24 bootstrap firmware image.
--firm file
This option specifies an alternative source file for DM24 Mk3 system firmware or for CD24 firmware. If not specified, the upgrade command will identify the digitiser type and, for DM24s, look in /usr/share/firmware/CMG-DM24mk3/ for files with names of the form dm24mk3-[0-9]*.img and use the most recent version that it finds. For CD24s, it will look for files with names of the form dm32_xx_*.hex in /usr/share/firmware/CMG-CD24/ where represents the hardware type (e.g. 4A, 8mR, etc) as determined by interrogating the digitiser. In either case, the program uses a lexical sort to determine which file contains the most recent firmware buid. The argument file should be the path to a valid firmware image.
--dsp file
This option specifies an alternative source file for DM24 Mk3 DSP firmware. If not specified, the upgrade command will look in /usr/share/firmware/CMG-DM24mk3/ for files with names of the form dm24mk3-dsp*.img and use the most recent version that it finds. It uses a lexical sort to determine which is the most recent. The argument file should be the path to a valid DM24 DSP firmware image.
--auto-baud
Scan the digitiser output to attempt to determine the Baud rate and adjust the configuration of the relevant serial port to match.
--verbose
Show most of the digitiser dialogue while the command is running.
--debug
This option turns on the production of some additional debugging information.
The dm24-upgrade command is the fastest and simplest way to upgrade the firmware on GSL-manufactured digitisers.
14.3.4 Rebooting
The “Reboot” item on the “Control” menu allows acquisition modules to be rebooted. CMG-NAMs can be both rebooted and powered off. To reboot from the command line prompt, use the reboot command.
eam999 ~ # reboot
14.3.5 Services
To control the service from the web interface, select:
Control → Services
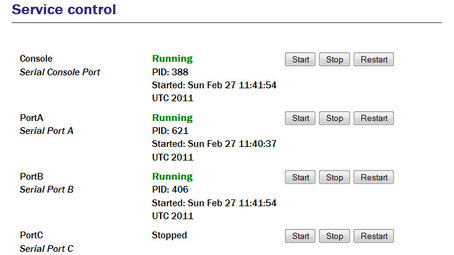
This screen gives a list of all configured services: services are the background programs that read, convert and and write data and carry out the individual functions of the acquisition module.
The services are presented in three columns. In the first is given the name of the service and, in italics, its description. The second column shows the word “Stopped” in red for any services which are not running and, for those which are running, the PID (process ID, a unique number which the operating system uses to keep track of running programs) and the date and time that this instance of the service was started. The third column has buttons allowing you to stop, start or re-start each service.
It is possible to monitor and control services from the command line using the ps command and various scripts in /etc/init.local and /etc/init.d. This should be familiar to Linux users but full details are beyond the scope of this manual.
14.3.6 RAID Array Services
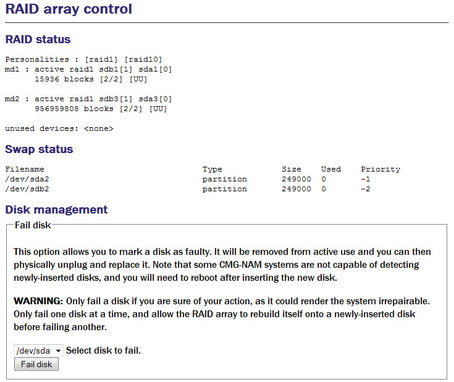
RAID arrays provide increased data security at the cost of extra storage devices. They can prevent the loss of data in the event of a single drive failure. The “RAID array” item on the “Control” menu will only be displayed on CMG-NAMs with RAID fitted. It displays a page which reports the status of and allows simple control of the fitted RAID array. The status of swap partitions are also reported on this page.
14.4 Tools Menu
14.4.1 CD1.1 log analyser
The CD1.1 log analyser is covered in a separate manual, the CD1.1 operations guide, MAN-EAM-1100, which is available for download from http://www.guralp.com/documents/MAN-EAM-1100.pdf
14.4.2 Environment logs
Platinum firmware has the facility to record environmental information such as temperature and supply voltage. Samples are recorded every ten seconds. The data can be subsequently downloaded or graphed. The parameters available for monitoring vary between models.
To configure the environment logs from the web interface, select:
Configuration → All options → GPIO labels and power switch settings → Logging
The screen displays the environment logging options:
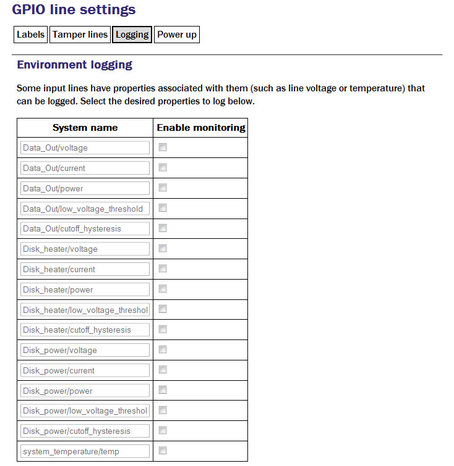
Tick the check-box next to each parameter you wish to monitor, then scroll to the bottom of the page and click  to record your choices.
14.4.3 Retrieving environment log data
Before data can be retrieved from the environment logs, the parameters that are to be logged must be selected, as described in the previous section.
To view or retrieve the logged data from the web interface, select:
Tools → Environment logs
The screen displays the query options:
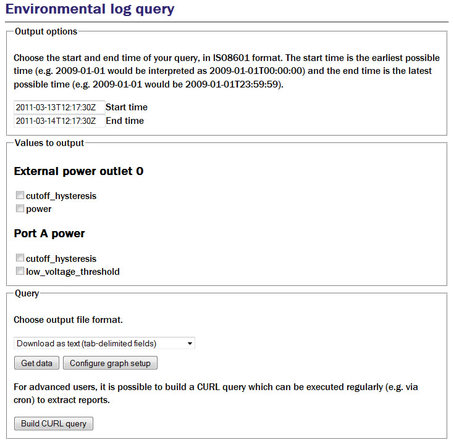
Output options: Enter the start and end times of the query. If you enter the same date without times (e.g. 2011-03-23) into both boxes, the query will select times covering 24 hours from midnight to midnight on the selected date.
Values to output: Select the value required by ticking the boxes. To change the available values, the environmental logging options will need updating as described in section 14.4.2.
Query: Select the output file format from the drop down menu. The options are:
Download as text (tab-delimited fields)
Download as CSV (comma-delimited text file)
Download as XML
View as table (HTML)
View as graph plot (PNG)
Download PNG graph plot
Clicking on 'Get data' performs out the selected query. If the selected format is PNG, extra configurations options are available by clicking 'Configure graph setup'.
14.4.3.1 Build CURL query
It is possible to schedule environmental data extraction using cron, the system job-scheduler. When the job is scheduled, the data are extracted from the server using a set of cURL instructions.
cURL is an open source project for transferring data from a server using a command line. At a very basic level, all you need to do is type curl at the command line followed by the output to retrieve. For example:
curl -output test.html www.example.com
would take the contents of the URL www.example.com and output it to the filename test.html. There are a whole range of arguments you can insert between the command and the URL. These are all explained in the cURL manual, available at: http://curl.haxx.se/docs/manual.html
When you click on 'Build CURL query', Platinum generates a cURL query based on the options you have selected on the environmental log page. For example:
curl --output eam3057-2011-03-13T12:40:30Z.txt \
--form-string output=txt \
--form-string start=2011-03-13T12:40:30Z \
--form-string end=2011-03-14T12:40:30Z \
--form-string value='Data Out power/power' \
--form-string value='Data Out power/voltage' \
--form-string action='Get data' \
--digest --user root:rootme \
http://eam3057/cgi-bin/envirolog.cgi
In this example, the device serial number is eam3057. The data are output as text. The start and end times are 24 hours apart. There are two environmental values selected. The username and password are set to the system defaults.
Copying the generated code into ta erminal emulator connected to the EAM will output the file in the same way that the 'Get data' button does on the environmental log page.
If the cURL command is to be used for automated scheduled data extraction, some editing is required. Contact Güralp Systems for assistance on how to tailor the command for your specific requirements.
14.4.4 Extract MiniSEED records
The MiniSEED compressor, gdi2miniseed, uses a ring buffer to store miniSEED records after conversion from GDI. The default size of the buffer is 64 M but can be changed from the compressor's configuration screen, as described in section 12.2.1. Records are never erased from the ring-buffer; the oldest records are over-written when the buffer becomes full. In a steady-state configuration, therefore, a fixed number of records, covering a fixed time period, are always present in the buffer.
If 512-byte records have been configured (as required for SEEDlink) a tool is available to extract some or all of these records and either download them (using the operator's browser) or write them to a file as a MiniSEED volume. Such files can then be manually copied from the system to removable storage, using the cp or mv commands, or to another system over the network, using scp or rsync, for example.
To extract MiniSEED records using the web interface select:
Tools → Extract MiniSEED records
The following screen is displayed:
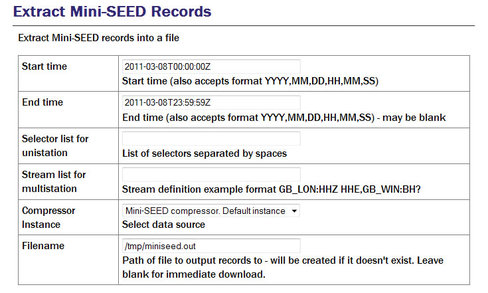
Start time and End time: Used to prevent the extraction of records whose timestamps fall outside the specified interval. The End time text-box may be left blank, in which case data up to the most recent are included in the extraction. Times may be specified in one of two formats: YYYY-MM-DDThh:mm:ssZ or YYYY,MM,DD,hh,mm,ss (where YYYY represents the four-digit year, MM the two-digit month (January is month 1), DD is the two-digit day-of month (counting from 1) and hh, mm and ss are the two-digit hour, minute and second, respectively. The data and time are UTC and all numbers should be padded with leading zeroes to make up the required length.
The data can also be filtered to extract one or more specific streams. The selection mechanism supports both the ubiquitous multistation mode and the less common unistation mode. Separate text fields are provided for specifying selections for each.
Selector list for unistation: Accepts a space-separated list of channel specifications. The channel name can be given in full or wild-cards and negations can be used: A question-mark character (?) is a single wild-card and will match any character in the same position; an exclamation-mark character (!) can be used to deselect a channel, so
BHZ selects just channel BHZ
BH? selects channels BHZ, BHN and BHE
HH? !HHZ selects HHE and HHN but not HHZ
!HHE selects all channels except HHE
Leaving this text field blank will select all channels.
Stream list for multistation: Can be left blank (to select all streams) or populated with a comma-separated list of stream specifications. Each specification is in the form NET_STA (where NET is the network identifier and STA is the station identifier, as used in S.C.N.L notation), optionally followed immediately by a colon (:) and then a space-separated list of channel selectors, as described in the previous paragraph.
For example, say a system is processing the following channels (in S.C.N.L notation):
B675.HHZ.KA.04
B675.CHZ.KA.0G
B675.SOH.KA.00
B675.HHE.KA.04
B675.HHN.KA.04
B675.BHE.KA.0M
B675.MME.KA.0A
B675.MMZ.KA.08
2200.BHN.GS.06
2200.HHE.GS.04
2200.HHN.GS.04
2200.BHE.GS.06
2200.BHZ.GS.06
2200.BHX.GS.06
2200.MMZ.GS.08
2200.MMN.GS.09
Leaving both the unistation and multistation lists blank will select all data.
A specification of GS_2200 would select all data from station 2200.
To select all data for HHE channels (from both stations) you could either use a unistation selector of HHE or a multistation selector of GS_2200:HHE,KA_B675:HHE - the second method would allow other streams to be selected in addition.
The specification GS_2200:HHE BH?,KA_B675:HHE will select data from the following channels:
2200.HHE.GS.04
2200.BHN.GS.06
2200.BHE.GS.06
2200.BHZ.GS.06
2200.BHX.GS.06
B675.HHE.KA.04The specification GS_2200:BH? !BHZ will select data from the following channels:
2200.BHN.GS.06
2200.BHE.GS.06
2200.BHX.GS.06
Database directory: The drop-down menu is used to select which gdi2miniseed compressor instance serves as the data source (each has its own ring-buffer).
Filename: If left blank, the extracted data are made available through the web-browser's file download facility and will typically be saved to the operator's PC's hard drive - details vary between browsers and the exact location can typically be configured by the user. If this field is populated with a file name, the data will be written to that file on the EAM. Any existing file with the same path name will be overwritten.
This functionality is also available from the command line with the extract_miniseed command. A usage message is displayed if the command is invoked with a -h argument.
14.4.5 GCF Audit Log Viewer
Detailed information about every GCF packet sent or received are stored on the GSL-EAM and can be viewed with the GCF Audit Log Viewer.
To access the GCF Audit Log Viewer from the web interface, select:
Tools → GCF audit log viewer
To access the same information from the command line, enter the command
gcflogview
The initial screen displays all GCF data sources and sinks in a table, together with some summary information. In the example given, it can be seen that Ports B and F are inactive, Port A was receiving GCF data until 16:36 and the default instance of the Scream network server was sending GCF data until the same time.
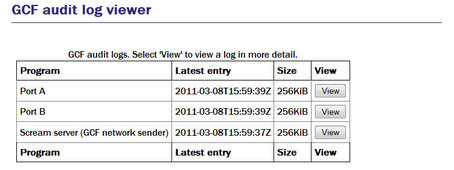
The “Size” column shows the size of the log buffer allocated to each data source or sink. The log buffer size can be changed from the relevant service or port configuration screens in expert mode.
For example, to allocate a larger log buffer to the GCF receiver running on Port A, click on “Serial ports” from the main menu, then on “Port A - GCF in”, “GCF input settings” and then click the “Expert” button. You will see a drop-down selection list labelled “Audit log size” from which you can select 64Kib, 256Kib, 2MiB or 16MiB.
To change the GCF audit log buffer size for the Scream network server from the web interface, select:
Configuration → Data transfer/recording → Services
Now then click on “GCF Scream network server”. Click on the entry for the instance you wish to change and then click the “Expert” button at the bottom of the page. You will see a drop-down selection list labelled “Audit log size” from which you can select 64Kib, 256Kib, 2MiB or 16MiB.
Each entry in the table has a “View” button, which shows detail from the relevant log at block (packet) level). The view for Port A is shown here:
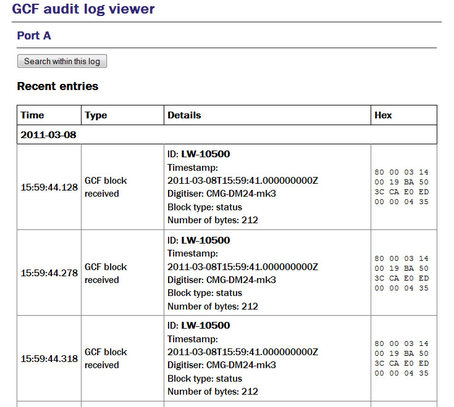
The first column shows the time-that the block was received (not the time-stamp on the block itself) and the second column shows the event type - “GCF block received” in most cases.
The “Details” column shows the stream ID from the received data block and the block time-stamp. The digitiser ID is shown if it is encoded in the block; otherwise, a best guess is displayed. The rest of the entry shows the block type, sample rate, compression level and the number of samples in the data block.
A hexadecimal display of the block header is shown in the final column.
14.4.6 GDI Channels Display
It is often useful, particularly when configuring a acquisition module for a complex array, to see a list of the Stream IDs, or channel names, which the CMG-EAM is receiving. The GDI Channels Display feature allows you to view a list of all active channels, together with some additional detail about each.
To access the GDI Channels Display from the web interface, select:
Tools → GDI Channels Display
Similar information is available from the command line via the command gdi-dump -l but the format is optimised for automated processing rather than human consumption. Giving the --help option provides usage details. Use of the web interface, however, is recommended.
The following summary screen is displayed:
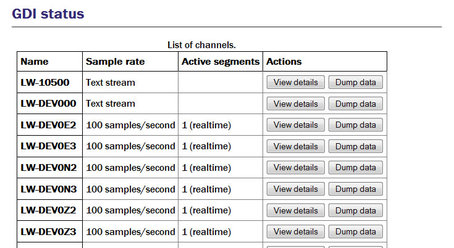
The first two columns show the names of the channels, together with information about the data format. The Active segments column shows details of data currently being received. A segment is a contiguous sequence of blocks so any data being back-filled always requires separate segments.
For each channel, you have the option of viewing detailed information about the data or the data itself, by use of the “View details” and “Dump data” buttons.
14.4.6.1 View details
The “View details” button displays the following screen:
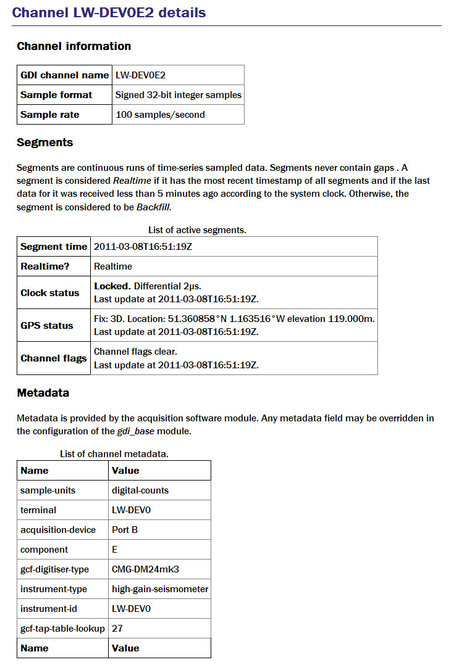
The top section shows the channel name, sample format and sample rate, as seen on the previous screen.
The centre section shows detailed information decoded from the packet header for each active segment.
The final section shows the metadata associated with the stream derived from the configuration parameters of the relevant input module.
14.4.6.2 Data dump
Check-boxes are available to toggle the display of both metadata and sample data. These can be changed at any time and the “Restart dump” button used to refresh the display.
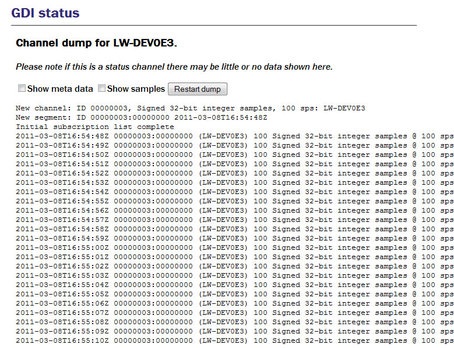
For sample data, each line displays the sample's time-stamp, the segment ID, the channel name in parentheses, the sample type and the actual sample value.
A button at the bottom of the screen allows the display to be refreshed with current data. There is also a button which, when clicked, returns the user to the main GDI Channels Display index page, so that another channel can be inspected.
14.4.7 Removable disk
Use of the mass storage device is described in chapter 11.
14.5 Routine tasks
14.5.1 The directory cleaner
The directory cleaner is used to delete files which would otherwise accumulate and, eventually, fill the file system. Non-configurable, system-provided instances monitor three directories, /var/lib/envirolog (which holds environmental logging data), /var/log/libterminal (which records terminal interactions with digitisers) and /var/lib/tamper (which records tamper-detection events). Additional instances can be created if required.
It is necessary to create a directory cleaner instance if you use the GDI link transmitter (gdi-link-tx). One directory cleaner instance is required for each gdi-link-tx instance. You may also use directory cleaner instances in association with your own scripts, to simplify programming.
To create a directory cleaner instance using the web interface, select:
Configuration → All Options → Routine tasks → Directory Cleaner
To configure an instance from the command line, start gconfig and select “Routine tasks” and then “Directory cleaner”.
The screen shows a list of all directory cleaner instances that have been configured:
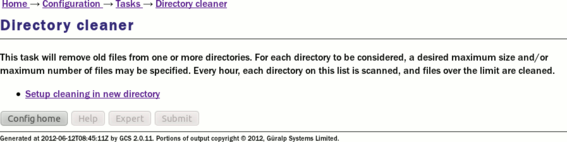
To edit an existing instance, click the appropriate link. To create a new instance, click “Setup cleaning in new directory”. The resulting screen allows you to configure the parameters of the selected instance.
14.5.1.1 Configurable parameters
All parameters for a directory cleaner instance are displayed on a single screen:
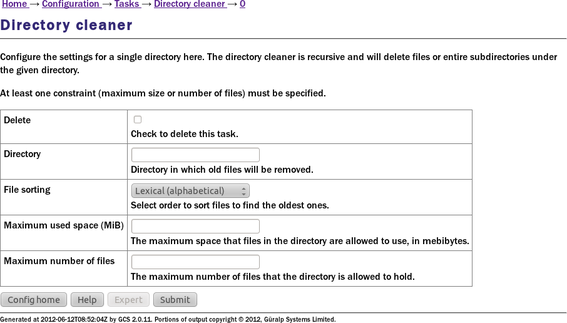
Delete: Causes this instance to be deleted from the system when the form is submitted.
Directory: Specifies the directory to be monitored and cleaned.
File sorting: Specifies the method used to determine which files should be deleted when the directory becomes too large. Several methods are available:
Lexical (alphabetical): this method sorts the files by their names in strict ASCII order. If the files are named after dates (in YYYYMMDD order) then this method will remove the oldest files first.
Reverse lexical: this method also uses strict ASCII order. If the files are named after dates (in YYYYMMDD order) then this method will remove the newest files first.
By version number: this method attempts to use a more natural sort order. It can cope with file-names like a0, a1, a2..... a9, a10, a11 and recognise the sequence. Files with lower numbers will be removed first. The exact algorithm comes from the standard GNU/Linux strverscmp function, for which documentation can easily be found on the web.
Reverse version number: this method uses the same comparison function as the one above but deletes files in the reverse order.
File modification time: this method ignores the file-names and deletes the files which were modified least recently.
Maximum used space (MiB): Specifies a threshold, in terms of storage space, that will trigger deletion in the directory. If the total size of the files in the directory is greater than the value specified here (in mebibytes), files are removed in the selected sort order until the threshold is no longer exceeded.
Maximum number of files: Specifies a threshold, in terms of number of files, that will trigger deletion in the directory. If the directory holds a larger number, excess files are deleted in the selected order until the specified number remain.
Note: At least one of Maximum used space (MiB) and Maximum number of files must be specified. If both are specified, they will both be respected.
Note: Each directory cleaner instance checks its configured directory once per hour so, if an application generates files rapidly, the total size or number of files in the directory may grow to considerably more than the configured threshold values.