The Fortimus is equipped with a multi-touch, 2.4 inch (61 mm), full colour LCD display that shows the instrument's state of health, inclination and real-time output waveforms. It also allows configuration of the instrument as well as some control operations.
While the Fortimus is booting up, it displays a white screen with the Güralp logo in the middle and a progress-bar at the bottom.
Once the Fortimus has booted up completely, the LCD automatically displays the “status” page.
To move back to the main menu, touch anywhere in the screen and the main menu will be displayed.
Note: When using the touch screen, keep your finger in place on each button for approximately half a second to ensure that your touch is registered. This delay helps prevent accidental triggering of menu functions. The LCD's touch features can be disabled completely if desired: see Section 5.6.3 for details.
The LCD behaviour can be configured in the Fortimus web interface, see Section 7.8 for more details.
The complete LCD menu map is illustrated in Section 15.
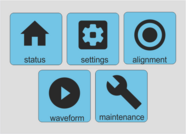
5.1 Main menu
The main menu offers the following options:
status
settings
alignment
waveform
maintenance
These are discussed in the following sections.
5.2 Status
The “status” page shows information about serial number, Bluetooth status, time and date, GNSS/PTP status, input voltage and power, humidity, temperature, microSD cards recording status, I.P. address.
The top of the status display shows a series of icons:
These, from left to right, correspond to synchronisation (), GNSS location (), WiFi reception () and Bluetooth status (). The icon does not appear if the relevant service is disabled. If the service is enabled but in a fault condition (i.e. not connected or no GPS fix found), the icon is shown with a line through it.
Warning and errors are shown here when necessary. Warnings are shown with an amber triangle on a grey background (), as shown on the left below. Errors are show with a red circle on an amber background (), as shown on the right.
The messages that can be displayed are:
Normal operation:
System OK : GNSS or PTP are locked, microSD cards are recording.
Warnings:
Warning! SD card not fitted : At least one of the microSD cards is not recording.
Warning! Waiting for PPS lock : PPS signal is unstable.
Errors:
Error! Clock not locked (0%) : GNSS quality is less than 95% and PTP is not available.
Error! Clock not locked (PTP 0%) : PTP quality is less than 80% and GNSS is not available.
Error! Clock not locked (NTP only) : GNSS quality is less than 95% and PTP quality is less than 80%.
5.3 Settings
The "settings" menu offers the following options:
display; and
network.
These are discussed in the following sections.
5.3.1 Settings → display
The "display" page allow control of brightness, the inactivity time-out and the orientation of the display.
The brightness can be set to be adjusted automatically, based on the ambient light level, or manually adjusted with the "lower" and "higher" buttons.
The display can be set to stay on permanently (with a consequent increase in power consumption) or to automatically switch off after 5 s, 10 s, 30 s, 60 s or 120 s of inactivity. The currently-selected mode is indicated by the green background.
When the display has been switched off, it can be switched on again by touching and holding for a second.
The orientation can be set to be normal or flipped. Selecting "auto-flip" will instruct the instrument to flip the display automatically based on attitude as determined by the internal MEMS accelerometer. The currently-selected mode is indicated by the green background.
5.3.2 Settings → network
The network page allows you to choose between DHCP mode, where the networking parameters are set by an external DHCP server, or static mode, where the network parameters must be typed in manually.
The current network mode is shown on the main status display:
If you select DHCP mode from the network page, you are asked for confirmation but no other configuration is required:
If you select static mode from the network page, you are prompted first for the IP address:
Enter the desired IP address using the on-screen virtual numeric keypad and then press "next", which takes you to the netmask screen.
Enter the desired netmask in the same way. Pressing "next" again takes you to the "Gateway IP" screen:
After entering the IP address of your gateway (default router), press "next" again to reach the confirmation screen:
Pressing "apply" here configures the Fortimus with the parameters that you have just entered. Pressing "cancel" discards all of the changes and the Fortimus' networking configuration is not affected.
5.4 Alignment
The “alignment” page shows a virtual bubble level based on the output of the MEMS accelerometer built-in the Fortimus. The red circle moves around the screen as the position of the Fortimus is altered, mimicking the bubble in a real bubble level; i.e. the red circle moves towards the highest part of the top of the instrument.
Note: The virtual bubble level works if and only if the MEMS accelerometer channels are enabled for streaming and/or recording.
See Section 6.1 for more details about using the alignment tool.
5.5 Waveform
The “waveform” page shows real-time data in graphical format. The horizontal axis represents time and the display constantly scrolls to the left as the latest data are plotted on the right-hand side of the graph. Three modes are available:
In "seismic" mode, the signals from the main acceleration outputs of the Fortimus are displayed.
In "accel…" mode, the outputs from the internal MEMS accelerometer are displayed.
In "auxiliary" mode, the display graphs the output from the internal temperature sensor, the internal supply voltage and the power consumption.
5.6 Maintenance
The “maintenance” page allows the user :to
reboot the system;
reset the configuration to factory values; and
lock the “settings” and “maintenance” pages to prevent undesired alteration.
These are discussed in the following sections.
5.6.1 Reboot
This option reboots the processor in the Minimus digitiser without interrupting power. Because this will interrupt digitisation and potentially affect the configuration (some changes only take effect after a reboot), it is protected by a confirmation screen.
Click if you wish to continue and if you have arrived at this screen unintentionally and wish to return to the main menu.
5.6.2 Restore factory settings
This option restores the configuration to the state in which the instrument was delivered. Because this will interrupt digitisation and affect the configuration, it is protected by a confirmation screen.
Click if you wish to continue and if you have arrived at this screen unintentionally and wish to return to the main menu.
5.6.3 Lock the configuration
This option locks the LCD interface so that the instrument can only be reconfigured via its web interface. This can be useful when physical access to the instrument cannot be fully controlled. Because this can be disruptive, this option is protected by a confirmation screen.
Click if you wish to continue and if you have arrived at this screen unintentionally and wish to return to the main menu.
Note:Once “settings” and “maintenance” are locked, they can only be re-enabled from the Fortimus web page. See Section 7.8 for more details.