Chapter 7. System configuration
Advanced system configuration control and configuration tools are available by selecting an instrument in Discovery, right-clicking its entry and selecting “View Web Page”. Alternatively, the web interface can be viewed by navigating to the LAN address of the instrument from any common web browser.
Note: Some changes in the settings require a system reboot to be applied. This is notified on the top right of the Fortimus web page with the message Reboot Required . It is suggested to perform all the modifications and reboot the Fortimus when the configuration is completed clicking on any of the 
7.1 Web Page login
The web interface can be protected by username and password. There are two levels of access to the web page: normal user and administrator.
If the login is required, the web interface will initially show a status display only.

Clicking on “Login” opens allows to type in the user-name and password to access the content of the web page.

Logging in with normal user account unlocks only basics configuration and control features in order to prevent any advanced settings to be modified. The default user-name for normal user login is user and password of user.
Logging in with the administrator account unlocks all the configuration and control features available in the Fortimus web page. The default user-name for administrator user login is admin and password of admin.
Once logged in, the “Web Login” drop-down menu in the Network tab allows to disable the request of login every time the web page is accessed. The user-name and password for both normal user and administrator login are configurable in the “Network” tab.

7.2 System status
The “Status” tab of the web browser interface provides state-of-health information about the Fortimus. These parameters are described as follows:
Host name: the serial number of the Fortimus;
Host label: the customisable name of the Fortimus system;
System type: the name of the connected instrument, e.g. “Fortimus”;
Product type: the type of the connected instrument, e.g. “Fortimus”;
Serial number: the serial number of the Fortimus;
Firmware version: the DIG firmware version running on the Fortimus;
IPv4 address: the static or Dynamic LAN I.P. address of the Fortimus;
SEED network and station: Network and Station SEED codes of the Fortimus;
Temperature, humidity, Input voltage and PoE voltage: the internal temperature and humidity of the Fortimus; input voltage supplied and optional PoE voltage supplied to the Fortimus;
System time: the current internal system date and time;
Uptime: the time the Fortimus has been running since the last reboot;
ETH status: the number of total active TCP connection in use and connection used for data transmission;
GNSS status, last GNSS timestamp, last GNSS lock time since significant timing drift or re-boot, GNSS stability of the lock, horizontal dilution of precision (based on satellite coverage), GNSS PPS status, GNSS NMEA stream, GNSS lock state (2-D or 3-D), number of satellites used and in view;
Latitude, longitude and altitude of the system, as provided by the GNSS receiver;
PTP state, last PTP timestamp, last PTP lock time since significant timing drift or re-boot, PTP stability in time accuracy, master IPv4 address (I.P. address of the PTP master), master clock class and accuracy, master time source, network path delay, network jitter estimate (quality indicator in ns), network outliers;
MicroSD card recording status, total storage capacity, used storage space and available storage space;
Real-time sensor values from the accelerometer.
7.3 Station meta-data
Discovery provides a number of flexible station meta-data inputs. These are accessible from the “Setup” tab of the instrument’s web page.
“Label” and “Site Name” are used in Discovery only and appears in the list of instruments in the main window.
“Station Name”, “Network Code” are all standard meta-data header values used by the miniSEED file format, which will be included in locally-stored miniSEED files (see Section 7.9).
7.4 Network configuration
7.4.1 I.P. address and gateway
By default, the Fortimus uses DHCP (Dynamic Host Configuration Protocol) to acquire its network configuration but static addressing can be used if required.
To configure static addressing, visit the “Network” tab of the instrument’s web page and, under “DHCP”, change the mode from “Enabled” to “Disabled” in the drop-down menu. In this mode, it is possible to specify the I.P. address, the Net Mask and the address of the Gateway (default router), as shown:

Before any changes made here will take effect, the Fortimus must be re-booted. To do this, click the 
Note: By default, the static I.P. address assigned to each Fortimus is unique and derived from the specific serial number of the device. These addresses are in the default network for link-local (APIPA) addresses: 169.254.0.0/16 (in CIDR notation).
The first two bytes of the address, therefore, are always 169.254. The third byte is the equal to the last two characters of the serial number interpreted as a hexadecimal number and then converted into base 10. The forth byte is the equal to the next-to-last two digits of the serial number, also converted from hexadecimal into base 10.
For example, if the serial number of the Fortimus is FMUS-C555, the preassigned Static I.P. address will be 169.254.85.197, where
FMUS-C555 ⇒ "55" ⇒ (55)16. = (85)10 ⇒ 85 and
FMUS-C555 ⇒ "C5" ⇒ (C5)16 = (197)10 ⇒ 197
Network settings are also available in Discovery by right-clicking on the Fortimus' entry in Discovery's main window and selecting “Edit Network Address”.

7.4.2 NTP (Network Timing Protocol) configuration
Note: Network Timing Protocol (NTP) is only used for setting the system's internal clock at boot-up, it is not used for sample timing. See Section 7.12 for details about synchronising the sample clock.
However: if neither GNSS nor PTP are available but NTP is locked and the sample clock's time is more than five seconds different from NTP's time, the sample clock will be adjusted (in a step-change) to NTP time.
By default, the NTP server option under the “Setup” tab of the instrument’s web page is set to “Pool” which uses the virtual server pool pool.ntp.org. This accesses a dynamic collection of networked computers that voluntarily provide moderately accurate time via the NTP to clients worldwide.
Alternatively, it is possible to specify the I.P. address of your preferred NTP server. To do this, select the “Static” option from the “NTP server” drop-down menu, which activates the “NTP IP Addr” setting, and enter the I.P. address of your NTP server here.

7.5 WiFi
The Fortimus can act as a WiFi client, connecting to an existing WiFi network. Both open and secure (WEP, WPA and WPA2) networks are supported.
Note: The Fortimus does not function as WiFi access point (AP) so it is not possible to connect a WiFi-enabled laptop, for example, directly to the unit. A separate WiFi AP is required in this case so that both laptop and Fortimus can connect to the same network.
The WiFi connection is configured and monitored from the “Network” tab of the Fortimus web page:

7.5.1 Connecting to a WiFi network
Visit the “Network” tab of the Fortimus web page and ensure that:
the "WiFi Enable" check-box is ticked; and
the "Auto Connect" check-box is clear as high-lighted above.
Use the "Access Points" drop-down menu to select the desired network and enter the password or passphrase in the "Password" text field, if required.
Click the 
Note: A Fortimus connect to a WiFi network automatically appears in Discovery's “Scan Locally” section only when (a) the computer running Discovery is connected to the same WiFi network and (b) the Fortimus’ Ethernet is disconnected or disabled.
7.5.2 WiFi connection status
The status of the WiFi connection is displayed at the top left of the WiFi section of the Network tab of the web page:

The possible values for the status are:
WiFi off - the WiFi interface is disabled. Tick the "WiFi Enable" check-box to enable the interface, if required.
WiFi Standby - the WiFi interface is enabled but not currently connected to any network. If no connection is required, clear the "WiFi Enable" check-box to disable the interface.
WiFi Connecting - the WiFi interface is in the process of connecting to the selected network.
WiFi Connected - the WiFi interface is connected to the network shown in the box below and the DHCP server has allocated the IP address displayed in the adjacent box. (Static IP addressing is not supported).
Once a successful connection is established, tick the “Auto Connect” check-box so that the Fortimus will attempt to reconnect to the same network whenever possible. The name of the selected network appears in the “Requested AP” box.
7.5.3 Changing WiFi networks

A different network can be selected from the "Access Points" drop-down menu – and the new password entered – while the Fortimus is still connected to a network. The instrument will not connect to the new network until the
7.6 GDI push (auto-connection)
A Fortimus normally acts as a GDI server, where a client initiates a connection in order to pull data from it. This is the mechanism used when the GDI viewer in Discovery is launched.
The "GDI auto-connection" feature enables the Fortimus to establish outgoing network connections in order to push data to one or more remote clients, such as Platinum systems or an Earthworm system running the gdi2ew plug-in.
To configure an auto-connection, type either the I.P. address or the host-name of the target client, a colon (':') and the port number (e.g. 192.0.2.91:1566 or affinity10.example.com:1566), into any of the connection fields in the “Network” tab of the web page.

When auto-connection from a Fortimus to a host is configured, the Fortimus will attempt to open a connection to the host. If it fails, it will re-try every 60 seconds. A suitably configured host will accept the connection and the Fortimus will then negotiate a link and start streaming data.
If the connection drops, the Fortimus will attempt every 60 seconds to reconnect.
Note: The default port number for a GDI-link receiver is 1566. Push servers will normally connect to this port. The default port number for a GDI-link transmitter is 1565. Receivers wishing to pull data will normally connect to this port. See Chapter 11 for a list of the network ports used by the Fortimus.
7.7 QSCD
The Fortimus can push data in QSCD format (Quick Seismic Characteristic Data) to one or more clients, using outgoing network connections.
To configure a connection, locate the QSCD section of the Network tab of the web page, as shown below. Type either the I.P. address or the host-name of the target client into any of the “Server” fields. This will push data using UDP port 9908, which is the default. If you wish to use a different port number, add a colon (':') and the port number to the end of the specification. For example, 192.0.2.91:9876 or qscd.server.com:9876.

The Fortimus does not automatically send all data when using the QSCD protocol. Channels to be transmitted must be selected (in Z/N/E triplets) and each channel passed through a QSCD transform. See Section 7.16.12 for details on how to configure this transform.
7.8 Controlling the LCD from the web interface
In the “Setup” tab of the Fortimus web page, the user can remotely control the LCD display settings.
Locking and unlocking of the “settings” and “maintenance” features can be selected using the drop-down menu named “Display settings”:

The display brightness is adjustable using the drop-down menu named “Display brightness”:

The display can be set to switch off after a selectable period of time while it is untouched. When the display is off, it can be switched back on by touching it for a couple of seconds.

The LCD is, by default, oriented with the top of the screen pointing North (relative to the instrument). The orientation can be flipped by 180 degrees if required or it can be set to "automatic". When the auto-flip is enabled the orientation changes according to the MEMS output.

For security reasons, the LCD's touch sensor can be disabled using the option “Touch sense”. Once disabled, touching the screen has no effect and no commands can be issued via the LCD.
To restore normal operation, set "Touch sense" to "Enable" from the Fortimus web page.

Note: "Touch sense" can be re-enabled only from the web interface. It is not possible to re-enable it using the LCD screen.
7.9 Data storage
The main panel of the "Data Record" tab in the web interface is shown here:

This page allows to configure the recording channels available in the Fortimus.
The names and contents of each file are described in Section 10.
Note: When changing a setting in the Fortimus web page, ensure that you wait until the page refreshes before changing another setting. This allows time for the previous change to take effect.
The drop-down box at the top-left of the page named “Display Streams” filters out visible channels among All, Enabled and Disabled. The option “Apply configuration for tap groups” automatically apply the same configuration to three streams that belong to the same tap, e.g. S0SeisZA, S0SeisNA, S0SeisEA.
The page is divided in four columns:
in most-left column, drop-down boxes are available for each channel to either select a sample rate or to exclude the channel from streaming (by selecting the “Disabled” option). All streaming can be stopped by clicking the


in second column from the left, drop-down boxes are available for each channel to enable/disable transforms and, once transform is enabled, to select the transform to apply (see Section 7.16);
in third column from left, Location and Channel SEED codes can be configured. Cells are greyed out by default (default values applied) and they can be edited by clicking on the check-box;
in most-right column contains links to the RESP files associated to each of the seismic channels (see Section 7.14.4).


Upon changing the sample rate, enabling a transform or changing Location and Channels codes, the Fortimus will need to be restarted for the changes to come into effect; this can be done by pressing the
During the reboot, the LEDs will flash, displaying the starting-up sequence (see Section 3.1.2) and the instrument web page will display the following screen.

Once the Fortimus has successfully restarted, the full web browser display and controls will be available for use again.
7.10 Storage
7.10.1 Recording status
MicroSD cards need to be specifically formatted to operate with the Fortimus. The cards shipped with the Fortimus and with Radian systems are supplied pre-formatted.
Data are stored on the microSD cards in miniSEED format. Each channel is saved as a series of 128 MiB files. Instrument and station meta-data (e.g. instrument response, coordinates, compression type etc.) are stored in "Dataless SEED" format.
The MicroSD card and data recording status can be monitored in the upper panel of the “Storage” tab.
The left-hand column provides details of the external (primary, removable) microSD card and the right-hand column shows the status of the internal (backup, fixed) card.

Sections of this panel indicate the status of the following:
Whether a card is inserted;
Whether an inserted card is usable (i.e. correctly formatted); and
Whether the card is recording data.
Note: If the recording status of the cards is marked NOT RECORDING, clicking on 

7.10.2 MicroSD card re-formatting
The card re-formatting process fills the card with 128 MiB files containing zeroes. Each file is given a temporary, place-holder name. When data are written, these files are renamed and then over-written with data.
There are two methods for card reformatting: “Quick format” and “Full format”. The quick format mode should be used for pre-deployment tests (e.g. stomp/huddle tests) to ensure that the instruments are operating properly. This mode simply marks the existing files as empty without deleting their contents. Full formatting should be used prior to a long-term deployment to ensure that all headers are included and files are fully clean before writing.
The formatting process formats both fixed and removable cards, sequentially.
Note: A series of tests separated only by quick formats can leave some files with residual data in them. This is not normally a problem because a deployment will typically create data-sets longer than any test, over-writing any data remaining from the tests. The miniSEED extractor utility described in Section 7.11.3.1 can be used to remove the residual data if they cause any problems.
7.10.2.1 Quick format
Ensure that the external microSD card is correctly inserted. Click the 

The instrument web page will refresh and return to the “Status” tab. The reformatting operation is now complete.
7.10.2.2 Full format
Ensure the external microSD card is correctly inserted. Click the

The process takes several hours: check the status countdown indicators on the top-right of “Storage” tab.

Caution: Do not remove or insert the external microSD card while formatting is taking place.
7.10.3 MicroSD card data flushing and unmounting
The 
The 
7.10.4 Download recorded data
The “Storage” tab of the web browser interface displays the miniSEED files stored on the microSD card:

Clicking on the file from the list automatically starts a download using your browser's standard mechanism:

Multiple files can be downloaded simultaneously by ticking the boxes on the left of each link and clicking on 
The microSD cards are formatted with empty files which are filled with data as they become available. The file-names are also changed when the files are written to. Until they are written to, they are marked as “hidden” files, so that it is easier to see how many files contain data when looking at the contents of the card.
7.10.5 Downloading data for specific time-intervals
Data for a single stream spanning a specific time-interval can be downloaded from the Storage page of the web interface. To do this, start by selecting the desired stream from the drop-down menu:

… then select the start and end dates and times using the pop-up calendars:

Lastly, click the 
Note: The pop-up calendars are not supported by Discovery's built-in browser. The required dates can simply be typed in or the entire operation can be performed in an external web browser.
7.10.6 Bulk data extraction
To view files saved on the external microSD card, remove the card, as described in Section 3.1.5. Insert the card into a microSD card reader (external or in-built) on your PC/laptop. Within a few seconds, the card should appear as a removable disk/drive.
A microSD card formatted for the Fortimus contains many "hidden" files. They are created at format time with no contents and then renamed, unhidden and filled with data as required.
When viewing files in Windows Explorer, it may be helpful to configure your system so that "hidden" files are not shown. In Windows 10, this can be done by clearing the “Hidden items” check-box within the ribbon of Windows Explorer.

7.10.7 The contents of the microSD card
The root directory of the disk contains seven items:
a file named init.log. This “write-once” file contains the first 32 MiB of system log information since the card was last formatted;
a file named system.log. This “re-use” file contains the last 64 MiB of the system log;
a file named status.log. This “re-use” file contains the last 32 MiB of damps of system state of health information. A new dump is generated every 20 minutes.
a disk image file which Güralp technical support may ask you to use if you have problems with the card;
a file named table_of_events.bin. This is not human readable: it is used by the Seismic Events Table in the “Trigger” tab
a directory named all_miniSEED_files_are_in_here. Within this directory, there will be a miniSEED file for each recording channel. The file-name prefix is the same as the channel name description given in the “Data Record” tab. Each file is 128 MiB in size.
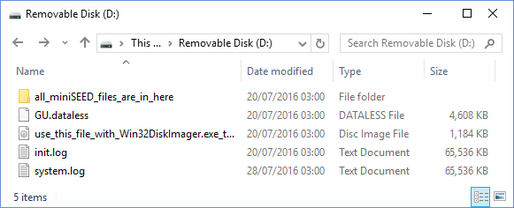

The typical contents of the all_miniSEED_files_are_in_here directory looks like this:

The file-name consists of four components:
The stream name, truncated to 16 characters – see Section 10 for a full list of these;
The sample rate, (in samples per second), as a ten-digit decimal number, left-padded with zeroes;
A number which functions as a counter to ensure unique name for all files. Each time a file is created, this number is incremented so that the next file to be created will use the next value; and
The .mseed extension which identifies this as a miniSEED file.
The “Storage” tab also shows links to five auxiliary files, which are either saved in the Fortimus' flash RAM or are dynamically generated:

network.DATALESS: where network is the two-character Network code defined in the “Setup” tab (e.g. GU.DATALESS). This file is a Dataless SEED volume that contains meta-data including instrument responses, coordinates, compression type etc. The Dataless SEED volume is generated from the .RESP files for each channel;
fram.log: FRAM log file (stored in FRAM);
calvals.txt: calibration values in the format compatible with the Scream! Software package (dynamically generated);
polezero.txt: poles, zeros and normalising factors in the format compatible with the Scream! software (dynamically generated);
calib.txt: calibration text file with poles, zeros and gains expressed in hexadecimal (stored in FRAM);
7.10.8 Request data from microSD card
Discovery can be used as viewer of seismic data locally recorded in the microSD card of a Fortimus.
Select the Fortimus of interested, right-click and choose “Data calendar view” to open the complete list of streams.

The calendar shows two weeks of data preceding the time when the request is sent and it includes all the available channels recorded in the microSD card, distinct by stream name and predefined colour.

Note: Any gap in the calendar view is symptom of a gap in the recorded data.
Use the mouse-wheel scrolling (or track- / touch-pad scrolling on a laptop) or highlight a portion of data, right-click and select “Zoom in” to zoom into the data. Multiple channel are selectable using key 
In Discovery, right-click on the Fortimus of interest and select “Live View” → “GDI” to open a data viewer window. Select the streams that are going to be backfilled with recorded data.
In the calendar window select the portion of data to backfill into the viewer. Right-click and select “Request backfill”.

The requested data is automatically imported in the GDI data viewer in Discovery.

Note: The time required to upload the data depends on the window duration and the sample rate. Subsequent requests are queued and a new one is served once the previous one is completed.
7.11 Data transmission
The monitoring and configuration of transmitted data is handled using the “Data Stream” tab of the instrument’s web page.

This page allows to configure the transmitted channels available in the Fortimus.
The names and contents of each channel are described in Section 10.
Note: When changing a setting in the Fortimus web page, ensure that you wait until the page refreshes before changing another setting. This allows time for the previous change to take effect.
The drop-down box at the top-left of the page named “Display Streams” filters out visible channels among Enabled and Disabled. The option “Apply configuration for tap groups” automatically apply the same configuration to three streams that belong to the same tap, e.g. 0ACCZ0, 0ACCN0, 0ACCE0.
The page is divided in four columns:
in most-left column, drop-down boxes are available for each channel to either select a sample rate or to exclude the channel from streaming (by selecting the “Disabled” option). All streaming can be stopped by clicking the

in second column from the left, drop-down boxes are available for each channel to enable/disable transforms and, once transform is enabled, to select the transform to apply (see Section 7.16);
in third column from left, Location and Channel SEED codes can be configured. Cells are greyed out by default (default values applied) and they can be edited by clicking on the check-box;
in most-right column contains links to the RESP files associated to each of the seismic channels (see Section 7.14.4).

Upon changing the sample rate, enabling a transform or changing Location and Channels codes, the Fortimus will need to be restarted for the changes to come into effect; this can be done by pressing the
During the reboot, the LEDs will flash, displaying the starting-up sequence (see Section 3.1.2) and the instrument web page will display the following screen.
Once the Fortimus has successfully restarted, the full web browser display and controls will be available for use again.
7.11.1 Scream! (GCF format + Scream protocol)
The Fortimus can act as a Scream! Server and streams data by sending GCF (Güralp Compressed Format) packets over a network connection using the scream data transmission protocol.
This is primarily intended to support Güralp’s Scream! Software (see Section 4.4.2) or any software that can communicate using the Scream! Protocol, including SeisComP3.
These include:
Güralp instruments with embedded acquisition modules (e.g. 40TDE)
Güralp DM24 and CD24 digitisers with embedded acquisition modules (e.g. Güralp DM24SxEAM[U])
Affinity digitiser
Network Acquisition Module (Güralp NAM)
Data can also be received by software that can communicate using the Scream! Protocol, including SeisComp3 and Earthworm.
Note: Güralp devices running the Platinum software can receive GCF data over the Scream protocol, but the GDI-link protocol is preferred in these cases.
7.11.2 GDI-link protocol
The Fortimus can also transmit data using the GDI-link protocol. GDI-link can currently be used with:
Güralp instruments with embedded acquisition modules (e.g. 40TDE)
Güralp DM24 and CD24 digitisers with embedded acquisition modules (e.g. Güralp DM24SxEAM[U])
Güralp Affinity digitisers
Güralp NAM (Network Acquisition Module)
Earthworm software (www.isti.com/products/earthworm/)
GDI-link supports both data push and pull from/to the Fortimus. See Section 7.6 to configure data push to one or more remote clients, e.g. NAM.
GDI-link provides a highly efficient, low latency method of exchanging data via TCP between seismic stations and data centres. The protocol allows state-of-health information to be attached to samples during transmission. A receiver can accept data from multiple transmitters, and a single transmitter can send data to multiple receivers, allowing maximum flexibility for configuring seismic networks. GDI-link streams data sample-by-sample (instead of assembling them into packets) to minimise transmission latency.
A significant advantage of GDI-link is that it has the ability to stream data pre-converted into real physical units instead of just as raw digitiser counts, obviating a requirement for receivers to be aware of calibration values.
For more information on GDI-link, please refer to Güralp manual SWA-RFC-GDIL.
7.11.3 SEEDlink protocol
The Fortimus can act as a SEEDlink server to send miniSEED data packets over a network connection. The SEEDlink server is enabled by default but it can be disabled and re-enabled if desired. The server has a configurable back-fill buffer.
Note: The Fortimus SEEDlink back-fill implementation is packet-based.
FortimusIn the “Network” tab of the Fortimus web page, select the desired SEEDlink mode.

The choices are:
“Enabled” - This is the normal operating mode. Choose between backfill buffer sizes of 2,048 records, 65,536 records, 139,264 records or 622,592 records;
“Disabled” - turns off the SEEDlink server; and
“Debug” - this mode produces additional messages in the seedlink.log. which may be helpful if trying to diagnose a problem. It is available with backfill buffer sizes as before and, additionally, 512 records.
Note: As a general guide, we find that 139,264 records is normally sufficient to store around one day of triaxial, 100 sps data.
Standard SEEDlink has a fixed packet size of 512 Bytes and each miniSEED packet is completely populated with data before it is transmitted. The Fortimus supports a modified version of SEEDlink that allows the transmission of incomplete packets. This improves latency.
Note: The modified SEEDlink is only available for EEW channels - i.e. the main seismic channels (generated with causal low latency filters) and the STA, LTA, STA/LTA ratio channels.
The user can specify the rate at which miniSEED packets must be transmitted. If populating complete packets would result in this rate not being achieved, incomplete packets are transmitted instead. The number of samples in each packet, therefore, depends both upon this setting and on the sample rate.
In the “Network” tab of the Fortimus web page select the interval in deciseconds (1 decisecond = 100 ms or 0.1 seconds) between miniSEED packets.

The modified SEEDlink protocol also allows the use of 256-byte records as an alternative to the standard 512-byte format. The “Data Record Size” drop-down menu on the “Network” tab of the Fortimus web page controls this behaviour.
Note: Not all SEEDlink clients can accept 256-byte records. Consult your client's documentation if in doubt.

To test the SEEDlink server, Güralp recommends using the slinktool software for Linux, which is distributed by IRIS. For more information and to download a copy, see http://ds.iris.edu/ds/nodes/dmc/software/downloads/slinktool/.
To show a list of available miniSEED streams, issue the command:
slinktool -Q IP-Address
which produces output like the following:
DG TEST 00 CHZ D 2016-09-13 10:42:18 - 2016-09-13 10:46:56
DG TEST 01 HHZ D 2016-09-13 10:42:18 - 2016-09-13 10:46:56
DG TEST 00 CHN D 2016-09-13 10:42:18 - 2016-09-13 10:46:56
DG TEST 01 HHN D 2016-09-13 10:42:18 - 2016-09-13 10:46:56
DG TEST 00 CHE D 2016-09-13 10:42:18 - 2016-09-13 10:46:56
DG TEST 01 HHE D 2016-09-13 10:42:18 - 2016-09-13 10:46:56
DG TEST 00 MHZ D 2016-09-13 10:42:18 - 2016-09-13 10:46:56
DG TEST 00 MHN D 2016-09-13 10:42:18 - 2016-09-13 10:46:56
DG TEST 00 MHE D 2016-09-13 10:42:18 - 2016-09-13 10:46:56
⋮
To print miniSEED data records of a single channel, you will need the following command:
slinktool -p -S DG_TEST:00HNZ.D IP-Address
which produces the following output:
DG_TEST_00_HNZ, 412 samples, 100 Hz, 2016,257,10:43:42.000000 (latency ~2.9 sec)
DG_TEST_00_HNZ, 415 samples, 100 Hz, 2016,257,10:43:46.120000 (latency ~2.6 sec)
DG_TEST_00_HNZ, 416 samples, 100 Hz, 2016,257,10:43:50.270000 (latency ~3.0 sec)
DG_TEST_00_HNZ, 413 samples, 100 Hz, 2016,257,10:43:54.430000 (latency ~2.6 sec)
DG_TEST_00_HNZ, 419 samples, 100 Hz, 2016,257,10:43:58.560000 (latency ~3.0 sec)
DG_TEST_00_HNZ, 418 samples, 100 Hz, 2016,257,10:44:02.750000 (latency ~2.6 sec)
DG_TEST_00_HNZ, 415 samples, 100 Hz, 2016,257,10:44:06.930000 (latency ~3.0 sec)
⋮
The SEEDlink server on the Fortimus also supports the use of the “?” character as a wild-card within network, station and channel codes. This allows you to request multiple streams using a single command.
Note: Because the '?' character has special meaning to the shell, it is safest to quote this character with a preceding backslash ('\') when used in command arguments.
7.11.3.1 MiniSEED extractor

The miniSEED extractor serves two purposes:
When an SD card is quick-formatted, each file is marked as unused but previously recorded data can still remain in them. Subsequent recordings overwrite these files from the beginning but, if the previous recording had a longer duration, old data will remain in the files. When the files are copied from the SD card to a PC, these older data can cause problems.
The format used on the SD cards consists of fixed-length, 128 MiB files. Some recordings might not use all of this space. When the files are copied from the SD card to a PC, this can cause wasted disk space.
The miniSEED extractor reads miniSEED files on the PC and copies them to a selected Destination folder, keeping track of the latest block time-stamp as it goes. If it encounters either an unused block or a time-stamp which is earlier than the previous one, it stops copying, truncating the output file at that point. This guarantees that each output file contains only blocks in time order and contains no wasted space.

To use the tool, select "miniSEED Extractor" from the Edit menu. Click the first 

The same tool can also generate a report of any gaps in the data from the input files. To use, select the input files as before and then click 
7.12 Synchronisation of the sample-clock
The Fortimus system synchronises its sample clock using an attached GNSS receiver or, if that is not available, Precision Time Protocol (PTP).
The currently supported GNSS systems are Navstar (GPS), GLONASS, BeiDou and Galileo.
Note: The GNSS can use only three different types of satellites simultaneously and GPS is always used, if available. The other two spots available can be either GLONASS, BeiDou or Galileo.
If visibility of the satellite constellation is available, this is the most accurate way to synchronise your digitiser. The Fortimus accessory pack includes a combined GNSS antenna and receiver for this purpose: see Section 3.2.2 for details.
7.12.1 GNSS lock status
This is available in the “Status” tab of the instrument’s web page.

A number of GNSS reporting parameters are given, including:
Connection status
Last GNSS update (sync) & last GNSS lock date/time
GNSS Stability:
0% = no receiver connected;
1% = receiver connected, but waking up (this can occur if the GNSS receiver has been moved a long distance since last power-up).
2-99% = view of sky obstructed.
100% = normal operation with clear view of sky
Latitude, longitude, altitude
Horizontal dilution of precision (quality of satellite fix due to position of satellites relative to receiver)
GNSS PPS status
GNSS NMEA streaming
GNSS lock state (2D/3D)
Number of available satellites (in use / in view)
7.12.2 Precision Time Protocol (PTP)
The Fortimus system supports timing provided through PTP.

The IEEE 1588 Precision Time Protocol (PTP) is a network protocol which uses modified network hardware to accurately time-stamp each PTP packet on the network at the time of transmission, rather than at the time that the packet was assembled. If you do not have an existing PTP infrastructure, the simplest way to use PTP is to add a "grand-master clock" to the same network segment as the digitisers. A typical such clock is the Omicron OTMC 100, which has an integrated GNSS antenna and receiver which it uses as its own synchronisation source. PTP timing can be extended over up to 100 metres of Ethernet cable or longer distances when fibre-optic cable is used. PTP is significantly more accurate than NTP but generally requires specialised hardware support.
In the “Status” tab of the Fortimus web page, a number of reporting parameters are given, including:
PTP state
Last PTP time-stamp and last PTP lock date/time
PTP Stability:
Standby ⇒ PTP is running but timing is provided by GNSS;
No Master ⇒ PTP not available;
1-100% ⇒ PTP locking process indicator. 100% indicates a time accuracy of better than 200 ns.
Master IPv4 address
Master clock class and accuracy
Master time source
Network path delay
Network jitter estimate: quality indicator
Network outliers
Under the heading “Network config” are four options:
Disabled ⇒ PTP is never used (default settings).
Run if needed – Offline backup ⇒ PTP is automatically enabled whenever the GNSS signal is lost. It is disabled while GNSS is available. This mode is used to minimise network traffic when GNSS is the primary timing source.
Run always – Online backup ⇒ PTP is always running but GNSS is used as the primary timing source. This mode is useful for faster fall-back from GNSS to PTP timing and for validation that PTP is available.
Run always – Override GPS = PTP is always running and takes priority over GNSS. This mode is useful in a system where PTP is the primary timing source, but GNSS may occasionally be connected for validation purposes.

PTP can be configured for multicast or unicast mode. In unicast mode, the server I.P. address must be specified. This is available in the “Network” tab of the digitiser’s web page.

7.13 Deploy mode: Full power-save
The Fortimus digitiser offers two deployment modes: "Normal" and "Power Save". "Full power-save" mode makes a number of configuration changes in order to reduce the unit's power consumption. This mode is particularly useful when using Maris digital ocean-bottom sensors.
The desired mode can be specified using the “Deploy mode” drop-down menu in the “Setup” tab of Fortimus web page. Changes are not applied immediately.

The final step is to click on the 

A thirty-second count-down will start before the system enters power-save mode. The screen changes and a new button is added:

You can cancel the operation before the countdown is complete by clicking the 
Caution: The power-save mode will disable the Ethernet and GNSS modules. You will not be able to continue to use the web interface.
Once in deploy mode, the only way to re-enable the Ethernet module is to connect to the Fortimus via a serial connection (see Section 9) or to use the GüVü Bluetooth app (see Section 8.3).
When a serial or Bluetooth connection is established, type the command powersave off in the console to disable the "Full power-save" mode and re-enable Ethernet communication.
7.14 Configuration and control of the accelerometer
7.14.1 Setting instrument (sensor) gain
The Güralp Fortimus strong-motion digital accelerometer features a remotely-switchable gain option that can be controlled from inside Discovery.
The gain is settable in the “Fortimus” section in the “Setup” tab of the Fortimus web page. Under the “Instrument Gain”, select a gain setting (options: ±0.5 g; ±1 g; ±2 g; ±4 g).

Note: A reboot is required after this change.
7.14.2 Sensor centring
The Fortimus accelerometer automatically centres when it is powered up. To manually re-centre click on 

7.14.3 Output polarity
The polarity of output from each component of the instrument is as follows:
Direction of ground acceleration | Polarity of Z output | Polarity of N/S output | Polarity of E/W output |
Upwards | positive | zero | zero |
Downwards | negative | zero | zero |
Northwards | zero | positive | zero |
Southwards | zero | negative | zero |
Eastwards | zero | zero | positive |
Westwards | zero | zero | negative |
If the ground accelerates northwards, this moves the casing of the instrument northwards and the N-axis inertial mass is left behind. From the instrument's frame of reference, the mass appears to have been deflected southwards. The feedback system then needs to provide a balancing force to accelerate it northwards and this, by design, will result in a positive output signal from the N/S component.
If the instrument is mounted with the 'N' arrow pointing downwards, gravity will try and pull the inertial mass in the direction of the instrument's N-axis. The feedback system then needs to provide a balancing force to accelerate it upwards which, from the instrument's frame of reference, is now southwards. This is the opposite of the situation described above, so the output from the N/S component will now be negative.
The converses are also true: if the ground accelerates southwards, the instrument will produce a negative output signal from the N/S component and if the instrument is orientated with it's 'N' arrow pointing upwards, it will produce a positive output signal from the N/S component
The polarity of the output signals with respect to acceleration can be demonstrated by selecting a sensitivity of 1 g, 2 g or 4 g and orientating the instrument as shown in the following diagram:

7.14.4 Instrument response parameters
Calibration is a procedure used to verify or measure the frequency response and sensitivity of a sensor. It establishes the relationship between actual ground motion and the corresponding output voltage. Calibration values, or response parameters, are the results of such procedures.
Response parameters typically consist of a sensitivity or "gain", measured at some specified frequency, and a set of poles and zeroes for the transfer function that expresses the frequency response of the sensor. A full discussion of poles and zeroes is beyond the scope of this manual.
The gain for a seismometer is traditionally expressed in volts per ms-1 and, for an accelerometer, in volts per ms-2. Other instruments may use different units: an electronic thermometer might characterise its output in mV per °C.
A calibration procedure is also used to establish the relationship between the input voltage that a digitiser sees and the output, in counts, that it produces. The results are traditionally expressed in volts per count. Each Fortimus is programmed at the factory so that it knows its own calibration values.
To explore the calibration values of the Fortimus’ sensor and digitiser, right-click the Fortimus in Discovery’s main window and select “Calibration” → “Calibration Editor”. The resulting screen is shown here shortened:

This form has one tab for each seismic component. The instrument's response values are:
The Digitiser Volts per Count (VPC) - the ratio between the input voltage and the digitised output value (“counts”). This field will be populated automatically with the correct value for this input channel of the Fortimus.
Analogue instrument gain – this specifies the output voltage of the accelerometer per unit of ground motion in ms-2, as measured at 1 Hertz.
The ADC offset is the quiescent output seen when digitiser input is zero. This field will be populated automatically with the correct value for this input channel of the Fortimus.
The Coil constant is the coil constant for the component being calibrated, in A/m/s2, as given on the analogue sensor calibration sheet.
The Calibration resistor is the value of the calibration resistor, in Ω, as given on the sensor calibration sheet. This is common to all sensor components.
The Normalising factor specifies the value that the transfer function (as specified by the poles and zeroes) must be multiplied by in order to provide unity gain at 1 Hz.
The Poles and Zeros describe the frequency and phase response of the component. They must be specified in Hertz.
The calibration parameters for one component can be copied to any other component of the same instrument, or other instruments. This is especially useful for poles and zeros, because they are typically identical for all three components of all instruments in a class.
The drop-down menu in the “Component configuration” section allows selection of what to copy: poles and zeros, gains or everything. The destination sensor and component(s) can be selected in the subsequent drop-down menus. Click on the 


The overall system calibration parameters can be exported and saved in a file for future use by clicking on the 

The resulting file-name will have the extension .conf. Values from an existing calibration file can be imported using the 


When transmitting MiniSEED data, the responses of the instruments and digitisers are encoded in a message called a “Dataless SEED” volume. The contents of these volumes can be displayed in human-readable form, known as RESP, by clicking on the “RESP file” link of each channel in the “Data flow” and “Data record” tab of the Fortimus web page.

Clicking on a RESP file link produces a page like this:

Right-click anywhere and select “Back” to return to the Fortimus web page.

To save a RESP file, right click on it in the main list and select "Save Link":

Note: RESP files are not available for channels that have a transform enabled. For details about transforms, see Section 7.16.
7.14.5 Inject a calibration signal
To check whether the Fortimus is correctly calibrated, go to the Setup tab of the web page and use the drop-down menu to choose between Triangle, Square and White Noise signal to be injected into the sensor's feedback loop.

Adjust the calibration signal amplitude at 100%, 50%, 25% or 12.5% of the DAC full range.

Note: The calibration channel, named 0ACCC0, produces an output if and only if the calibration is in progress.
While the calibration is in progress, the webpage shows the warning message 

7.15 Setting sensor orientation and depth parameters
7.15.1 Applied rotation
A Matlab extension for Scream! allows easy determination of the exact orientation of a sensor relative to a surface reference sensor (which can be accurately aligned magnetically or geographically. The procedure is explained at https://www.guralp.com/howtos/determining-sensor-orientation.
The Relative Orientation extension of Scream! provides a correction angle that can be entered into the Sensor Orientation section of the Fortimus web page.

Note: The input rotation is automatically applied to both transmitted and recorded data.
7.15.2 Instrument installation parameters
The Dip (tilt angle from vertical), Azimuth (tilt direction from North) and Depth of Fortimus can be set in the “Setup” tab of the web interface in the section “Instrument Installation Parameters”. The instrument to which the displayed parameters apply is selected using the drop-down menu.

Note: The orientation and depth are not applied to the data, the parameters are only saved in the Dataless SEED.
7.16 Transforms
The Fortimus is capable of applying mathematical transforms to the streamed and recorded data. These include low-pass and high-pass filters, integration, differentiation, rotation, STA/LTA trigger etc.
When a specific transform is activated on a particular channel, the resulting streamed (or recorded, accordingly to the chosen configuration) data output is automatically transmitted and/or recorded with the transform applied. The units-of-measure are re-calculated accordingly.
Transform functions are enabled or disabled from the “Data Stream” and “Data Record” tabs for each channel.

Note: To enable or disable a transform on any channel, it is necessary to reboot the Fortimus. Transforms can be applied only on enabled channels.
Pass-through – see Section 7.16.1.
2nd order bi-quadratic filter – see Section 7.16.6.
1st order low-pass filter – see Section 7.16.3.
1st order high-pass filter – see Section 7.16.4.
1st order band/Notch filter – see Section 7.16.5.
STA/LTA ratio – see Section 7.16.10.
Integration – see Section 7.16.7.
Double integration – see Section 7.16.8.
Three-dimensional rotation – see Section 7.16.11.
EEW parameters – Observer – see Section 7.16.9.
Differentiation – see Section 7.16.2.
QSCDx sender – see Section 7.16.12.
MMA logger – see Section 7.16.13.
Some transforms require parameters such as frequencies or coefficients. For these, the user can either use a fixed, default set, or create their own custom set.
To use customised parameters, visit the “Transform” tab and select the “Saved User Parameters” option in the “Parameter Source” drop-down menu. Type in the required parameters and then click 

The various transforms are each described in the following sections.
Caution: The 
7.16.1 Pass-through
This null transform simply outputs a copy of the input data, without applying any transform. It has no configuration parameters.

Note: This transform is selected by default when transforms are first enabled or when an invalid transform is selected. Do not use pass-through as a method of disabling transforms: instead, select "Disable transforms" from the drop-down menu next to each stream on the "Data Streams" tab,
7.16.2 Differentiation
This transform differentiates the input data, e.g. if the input is a velocity (ms-1) channel, the output will be acceleration (ms-2). It has no configuration parameters.


7.16.3 1st order LPF
This transform applies a first-order low-pass filter to the input data.

The single configurable parameter is "Corner Frequency": this specifies, in Hz, the frequency at which the output power is attenuated by -3 dB. Above this frequency, output power is attenuated by a further 6 dB per octave or 20 dB per decade.

7.16.4 1st Order HPF
This transform applies a first-order high pass filter to the input data.

The output is the difference between a low-pass filtered copy of the signal and the unfiltered signal.
The single configurable parameter is "Corner Frequency": this specifies, in Hz, the frequency at which the output power is attenuated by -3 dB. Below this frequency, output power is attenuated by a further 6 dB per octave or 20 dB per decade.
Note: The high-pass filter is implemented by subtracting the output of a low-pass filter from the unfiltered data:


7.16.5 1st Order Band/Notch filter
This transform applies first-order band stop or Notch filter to the input data.
The band-stop filter is implemented as a configurable chain of two components:
A 1st order high pass filter (implemented using an LPF and a subtractor, as described in Section 7.16.4), to gradually attenuate low-frequency integrator drift.
A 1st order low pass filter (implemented as described in Section 7.16.3).
The configurable parameters are the "High Pass Frequency" (HPF corner frequency as defined in Section 7.16.4) and the “Low Pass Frequency” (LPF corner frequency as defined in Section 7.16.3).

7.16.6 2nd Order biquad
This transform applies a second-order bi-quadratic filter to the input data.

The biquad filter is a second-order recursive linear filter, containing two poles and two zeros. In the Z-plane, the transfer function is the ratio of two quadratics in z, as shown.
The two configurable parameters are:
"Corner Frequency": this specifies, in Hertz, the frequency at which the output power is attenuated by -3 dB; and
"Type":
0: low-pass mode; and
1: high-pass mode.

7.16.7 Integration
This transform integrates the input data, e.g. if the selected channel unit is velocity (ms-1), the output produced is displacement (m).

The integration transform is implemented as a configurable chain of three components:
A DC filter (2nd order high-pass bi-quadratic) removes any DC component, which would cause the output to grow without limit;
The integrator itself; and
A 1st order high pass filter (implemented using an LPF and a subtractor, as described in Section 7.16.4), to gradually attenuate low-frequency integrator drift.
The configurable parameters are:
"DC Cut-off Frequency": this specifies the -3 dB point (in Hertz) for the initial high-pass filter;
"Output Cut-off Frequency": this specifies the -3 dB point (in Hertz) for the output high-pass filter;
“Configuration Mode”, which configures how many elements of the chain are used. The options are:
Apply only the initial DC filter;
Apply the DC filter and the integrator; and
Apply the DC filter, the integrator and the output HPF.

7.16.8 Double Integration
This transform integrates the input data twice so, for example, if the selected channel is acceleration (ms-2), the output produced is displacement (m).

Analogously to the single integrator, the double integrator applies an initial DC high-pass filter and then two further high-pass filters, one at the output of each integrator. The high-pass filters are implemented using an LPF and a subtractor, as described in Section 7.16.4.
The configurable parameters are:
"DC Cut-off Frequency": this specifies the -3 dB point (in Hertz) for the initial high-pass filter;
"Interstage Cut-off Frequency": this specifies the -3 dB point (in Hertz) for the first integrator output high-pass filter;
"Output Cut-off Frequency": this specifies the -3 dB (in Hertz) point for the second integrator output high-pass filter;
“Configuration Mode”, which configures how many elements of the chain are used. The options are:
Apply only the initial DC filter;
Apply DC filter and first integrator;
Apply DC filter, first integrator and interstage HPF;
Apply DC filter, first integrator, interstage HPF and second integrator; and
Apply DC filter, first integrator, interstage HPF, second integrator and second output HPF.

7.16.9 EEW Parameter Observer
When an EEW trigger occurs (or is simulated – see below), the peak ground motion values (Peak Ground Acceleration (PGA), Peak Ground Velocity (PGV) and Peak Ground Displacement (PGD)) are calculated and automatically recorded over the selected time-window and subsequently transmitted as a CAP message (see Section 7.17 for more details). This transform allows the operator to directly observe the acceleration, velocity and displacement output on the real-time streams. It is available for use with both velocity and acceleration input signals.
Note: The EEW parameter transform can work as an observer: doesn’t necessarily modify the data streams on which it is applied.

The high-pass filters are implemented using an LPF and a subtracter, as described in Section 7.16.4.
The configurable parameters are:
"DC Cut-off Frequency": this specifies the -3 dB point (in Hertz) for the initial high-pass filter;
"Interstage Cut-off Frequency": this specifies the -3 dB point (in Hertz) for the first integrator output high-pass filter. This is only used when the input signal is acceleration;
"Output Cut-off Frequency": this specifies the -3 dB (in Hertz) point for the sole (velocity input) or final (acceleration input) integrator output high-pass filter;
"Window time": this specifies the duration, in seconds, of the time-window over which the peak values are reported; and
The values to be shown in the output stream:
Peak Ground Acceleration (PGA);
Peak Ground Velocity (PGV); or
Peak Ground Displacement (PGD).
Note: Güralp recommend using the integration (Section 7.16.7) and double integration (Section 7.16.8) transforms to test the filter parameters, because the effect of the parameters will then be clearly visible in the transformed streams. Once suitable parameters have been determined, they can be copied to the EEW Parameter Observer transform.

7.16.10 STA/LTA Ratio
The Earthquake Early Warning system (EEW) compares the ratio of a short-term average (STA) to a long-term average (LTA) in order to detect "trigger" conditions. For more information see Section 7.17.
This transform is included to help determine parameters for configuring the EEW system. It does not affect the operation of the EEW system in any way. The transform calculates the ratio between the result of the Short Term Average filter and the Long Term Average filter. The input signal is passed through a high-pass filter which removes any DC offset.

The configurable parameters are:
"DC Frequency (Hz)": this specifies the corner frequency (-3 dB point) in Hertz for the initial high-pass filter;
"LTA Period (seconds)": this is the Short Term Average filter time period (the reciprocal of the corner frequency);
"STA Period (seconds)": this is the Long Term Average filter time period (the reciprocal of the corner frequency);
“Trigger Threshold”: this is the STA/LTA ratio threshold value above which a trigger will occur;
“Event Window (Seconds)”: this is the duration of the event after the STA/LTA trigger occurs; any subsequent threshold crossing within this period is treated as belonging to the same event. This can be used to avoid spurious false triggers.
“Initial Timeout (Seconds)”: this specifies an initial period of insensitivity after the trigger function is initialised or changed. This can be used to avoid spurious false triggers.
The high-pass filter is implemented using an LPF and a subtracter, as described in Section 7.16.4.

7.16.11 Three-dimensional rotation
This transform rotates three velocity/acceleration seismic components in space. Rotations are represented by unit quaternions (in preference to the more usual Euler angles: yaw, pitch and roll) because they are unambiguous and avoid the problem of gimbal lock.
Note: The rotation transform can only be applied if it is enabled in all three velocity/acceleration components of a single instrument at the same sample rate.

Any rotation in three dimensional space can be represented as a combination of a unit three-dimensional vector, u⃗, which specifies the axis (and sense) of the rotation, and a scalar angle, θ, which specifies the amount of rotation
Güralp follows a North, East, Up convention when describing sensor orientation. Using this convention, we can represent u⃗ as [u,v,w] and use Pauli's extension to Euler's formula:
to form a quaternion:
where:
For example, a perfectly- oriented sensor has a (null) rotation of
, where the sensor's Z, N and E axes align with the North, East and Up global axes.
A rotation of
represents a sensor that has been rotated 90o about its x axis to align the sensor's Z, N and E axes with global North, Down and East respectively.

In the degenerate case of a simple rotation about a vertical axis (commonly used to correct data from a misaligned borehole instrument), the axis of rotation is vertical, so our unit vector is [0,0,1] (following the "North, East, Up" convention). To rotate by θ (where positive θ is clockwise when looking upwards), our quaternion should be:
As a final check, note that
which satisfies our requirement for a unit quaternion. The parameters to enter in the Configure Transforms fields are, therefore:
Scalar ⇒
, X ⇒ 0 , Y ⇒ 0 and Z ⇒

7.16.12 QSCD Sender (triplet)
The QSCD protocol (Quick Seismic Characteristic Data) transmits values computed from the three triaxial streams of an instrument. One packet is transmitted every second so the number of samples in each packet is equal to the sample rate of the three input streams.
QSCD calculations are implemented using transforms and configured via the Data Stream tab of the Fortimus web page. The three input channels must all be configured with the QSCD (triplet) transform. (The transform is disabled if the sample rates of the input streams do not match.)

In the Transform tab, the parameter “Period length” configures the number of samples to include in a QSCD packet. For example, QSCD20 requires the sample rate of the streams to be 20 sps so the “Period length” must be set to 20 (samples), in order to send a packet every second.

7.16.13 MMA Logger
The MMA logger transform [is a function that periodically calculates and logs Maximum Minimum and mean (Average) values over a selected window of data.
Note: The EEW parameter transform is an observer: doesn’t modify the data streams on which it is applied.
The two configurable parameters are:
"Short Period Length": this is the length of time between logging events expressed in samples, e.g. 200 samples when applied to a tap configured at 100sps produces an MMA calculation and logging every 2 seconds.
“Window Length in Short Periods”: is the length of window over which the Max, Min and Average values are calculated, in terms of number of short periods.

7.17 Earthquake Early Warning
The “Trigger” tab is dedicated to Earthquake Early Warning settings. These are disabled by default because of the amount of processing resource – and hence, power – consumed by triggering calculations.
The Triggers section of the web page enables the user to configure the triggering system. The trigger Sources should be configured firstly because different configuration options are displayed for different source types. Once the source-specific settings are configured, the scores and destinations should be specified. Destinations can be shared between sources, allowing the creation of networks (directed graphs) of systems for distributed event detection.
The heart of the Earthquake Early Warning subsystem are the triggering algorithms: an STA/LTA (Short-Time-Average divided by Long-Time-Average) and level (threshold) algorithms.
The STA/LTA algorithm continuously calculates the average values of the absolute amplitude of a seismic signal in two simultaneous moving-time windows. The short time average (STA) is sensitive to seismic events while the long time average (LTA) provides information about the current amplitude of seismic background noise at the site. When the ratio of STA to LTA exceeds a pre-set threshold value an event is “declared”.
The threshold algorithm, instead, declares the presence of an event when the raw data in input passes above or below a pre-set threshold value.
7.17.1 Trigger sources
The available sources for the trigger are listed below, along with the configurable fields available in each case.
1st/2nd/3rd/4th Remote Source: This setting is used for multiple-source triggering networks. The sources specified here are other Fortimus or Minimus based instruments, specified by the I.P. addresses configured in the “Remote Inputs” section:
The configurable fields in these cases are:
Score: this assigns a number of points to this trigger. The points value is used when assessing multiple-source triggers. This value is ignored when a trigger is not configured to use multiple sources.
Destination: this drop-down menu specifies the destination for the trigger. See Section 7.17.2 for more information.

nth Address: is the I.P. address of the remote source, e.g. another Minimus.

1st/2nd/3rd/4th I/O Expander Input: Select this value to use inputs from a connected Fortimus 8 channel I/O Expander Module.
The configurable fields in these cases are:
Score: this assigns a number of points to this trigger. The points value is used when assessing multiple-source triggers. This value is ignored when a trigger is not configured to use multiple sources.
Destination: this drop-down menu specifies the destination for the trigger. See Section 7.17.2 for more information.

Tap Trigger N:: seismic or environmental Fortimus channels selectable among any of the active taps in the “Data Stream” and “Data Record” tabs.
The configurable fields in these cases are:
Score: this assigns a number of points to this trigger. The points value is used when assessing multiple-source triggers. This value is ignored when a trigger is not configured to use multiple sources.
Destination: this drop-down menu specifies the destination for the trigger. See Section 7.17.2 for more information.

Sensor number: this drop-down menu is required to enables the trigger on one of Sensor0, the Fortimus.
Tap: this drop-down menu select the stream to use as input of the trigger algorithm. The choice is between single taps, e.g. 0ACCZ0, or triplets, e.g. First Seismo Triplet.
Trigger type: this drop-down menu chooses to use either STA/LTA or threshold algorithm.


The STA/LTA trigger algorithms includes the configuration of the following parameters:
“DC Frequency”: initial AC coupling HPF corner frequency;
“LTA Period”: Long Term Average filter time period (1/corner frequency);
“STA Period”: Short Term Average filter time period (1/corner frequency);
“Trigger Threshold”: STA/LTA ratio level at which trigger occurs;
“Event Window”: After and even has been detected, subsequent crossing of the STA/LTA ratio threshold within the defined event window are treated as part of the same event and, therefore, not considered as new trigger event;
“Initial Timeout”: period of inactivity after the trigger function is initialised in order to avoid false triggers.

The threshold trigger algorithms includes the configuration of the following parameters:
“Absolute Mode”: specifies if the threshold has to act on magnitude with sign (0) or absolute value of the signal (1).
“Low/High Mode”: defines whether the threshold is exceeded when the signal passes below it (0) or above it (1);
“Threshold”: value of the threshold expressed in native signal unit, e.g. m/s2;
“Timeout”: specifies the time to wait (in seconds), after the threshold crossing, before accepting a new event;
“Hysteresis Percentage”: defines the hysteresis point in terms of percentage of threshold value below or above threshold. The hysteresis point is below the threshold for High Mode, above the threshold for Low Mode.

The “Preview in Stream” box temporally shows the in the live streams the output calculated by the trigger algorithm, e.g. the STA/LTA ratio. In the STA/LTA ratio trigger, when a single stream is selected as source, the calculated STA/LTA ratio is shown in place of the original data.
Note: Only STA/LTA ratio has preview on single streams, both Threshold and STA/LTA ratio have preview of triplets.
When a triplet is selected as source, “3D or Z & NE” parameters is used to choose what type of preview to visualise.
For STA/LTA ratio trigger algorithm:
0: shows STA/LTA ratio calculated on 2D resultant vector of N and E components. The 2D STA/LTA ratio is shown in place of original E/W component. Also, shows the STA/LTA ratio calculated on Z component and it is shown in place of original Z component. N/S component shows normal seismic output.
1: shows STA/LTA ratio calculated on 3D resultant vector of Z, N and E components. The STA/LTA ratio is shown on E/W component. Z and N/S components show normal seismic output.

For Threshold trigger algorithm:
0: shows the 2D resultant vector of N and E components. The 2D resultant is shown in place of E/W component. Z and N/S components show normal seismic output.
1: shows the 3D resultant vector of Z, N and E components. 3D resultant is shown in place of E/W component. Z and N/S components show normal seismic output.

7.17.2 Trigger destinations
The options available form the various Destination fields are:
1st/2nd/3rd/4th CAP receiver: When a trigger is declared, the system will issue messages using the Common Alerting Protocol (for the full specification of this protocol, please refer to http://docs.oasis-open.org/emergency/cap/v1.2/CAP-v1.2-os.html). This field selects to which of the four available CAP receivers the trigger information should be sent to.


Various parameters control how the CAP message is created:
nth CAP Address: the I.P. address or DNS name of the CAP receiver;
nth CAP Port: the UDP port on which the CAP receiver is listening;
Total Score: this is an information field, it displays an automatically-calculated total of the scores from all of the input sources that specify this destination;
nth CAP Threshold: this threshold is used when multiple input sources contribute to this trigger. Otherwise trigger threshold from source configuration is used.
nth CAP Msg scope: this value is copied to the “scope” field of the CAP message;
nth CAP Recipient: this value is copied to the “addresses” field of the CAP message;
nth CAP Inhibit Timeout: is the time the Fortimus waits before sending new CAP message if a new event is detected after a previous CAP message was sent;
nth CAP Acceptance Window: subsequent source triggers for a given destination are counted towards the cumulative score if they arrive within this window;

CAP Msg Expiry: this parameter determines the value used to populate the optional “expires” field in the CAP message. If required, it should be specified in seconds.
CAP Msg Web URL: this parameter determines the value used to populate the optional “web” field in the CAP message. It should be a full, absolute URI for an HTML page or other text resource with additional or reference information regarding this alert.
CAP Msg HMAC Key: a shared key used for signing the CAP message. All CAP messages generated by Fortimus are signed. The user should set this key to a private value. The HMAC digest can then be used to both authenticate the sender and validate the contents of CAP messages by anyone who is privy to the shared key. This prevents the generation of false, malicious CAP messages by a third party.
EEW parameters (PGA, PGV and PGD values) are sent in the CAP messages body if and only if the “EEW parameter – Observer” transform is enabled on the source taps (see Section 7.16.9).
1st-8th I/O Expander Output: Select this value to use outputs from a connected Fortimus 8 channel I/O Expander Module. See MAN-MIN-1001 for more details.


Various parameters control how the I/O Expander behaves:
nth Hold Time: is the relay switch timeout in seconds. If configured to 0: no timeout is used, otherwise relay will be released after specified number of seconds;
nth Total Score: this is an information field, it displays an automatically-calculated total of the scores from all of the input sources that specify this destination;
nth Score Threshold: this threshold is used when multiple input sources contribute to this trigger. Otherwise trigger threshold from source configuration is used;
nth Inhibit Timeout: is the time the Fortimus waits before sending new command to the I/O Expander if a new event is detected after a previous command was sent;
nth Acceptance Window: subsequent source triggers for a given destination are counted towards the cumulative score if they arrive within this window.
1st/2nd/3rd/4th Remote Source: This setting is used for multiple-destination triggering networks. The destinations specified here are other Fortimus or Minimus based instruments, specified by the I.P. addresses configured in the “Remote Outputs” section:


nth Address: the I.P. address of the remote Fortimus;
nth Total Score: this is an information field, it displays an automatically-calculated total of the scores from all of the input sources that specify this destination;
nth Score Threshold: this threshold is used when multiple input sources contribute to this trigger. Otherwise trigger threshold from source configuration is used.
nth CAP Inhibit Timeout: is the time the Fortimus waits before sending new message if a new event is detected after a previous message was sent;
nth Acceptance Window: subsequent source triggers for a given destination are counted towards the cumulative score if they arrive within this window.
7.17.3 Low Latency Mode
In the “Setup” tab, the “Low Latency Mode” drop-down menu controls the processor workload that affects the power-consumption of the Fortimus. This control can be used to prioritise power-consumption at the expense of latency, to balance the two or to optimise latency regardless of the power consumption. Three settings are available:
Minimum Power ⇒ slow processing / higher latency;
Balanced ⇒ optimal;
Minimum latency ⇒ fast processing / lower latency.

7.17.4 CAP receiver
Güralp Discovery includes a CAP (Common Alerting Protocol) receiver. It listens on a specified UDP port for incoming CAP messages. When one arrives, it is displayed and plotted on a map. In addition, the receiver can open a TCP connection to the cloud-based registry server and display CAP messages that have been sent to the registry server. See Section 7.18 for information about configuring a registry server.
All CAP messages can be stored in a log-file. The full message is recorded so that it can be re-loaded later, if required.
The CAP receiver functionality is accessed using the context (right-click) menu in Discovery or clicking on “Edit” in the menu bar:

The CAP receiver window allows specification of the listening port. Each Fortimus from which messages should be received must have this value specified as the “CAP Port” in its triggering settings (see Section 7.17.2). The value should be between 1025 and 65535. You should avoid numbers in the list at https://en.wikipedia.org/wiki/List_of_TCP_and_UDP_port_numbers.

The reception of CAP messages can be enabled or disabled clicking on the 
If you wish to forward the CAP messages to a server, type its IP address into the field and tick the check-box named “Use forwarding server”. An error message is displayed if the entered IP address is not valid.

To log CAP messages to a file, tick the “Log events” check-box and use the 

To import an existing database of events, first enable logging, then browse to the file using the 
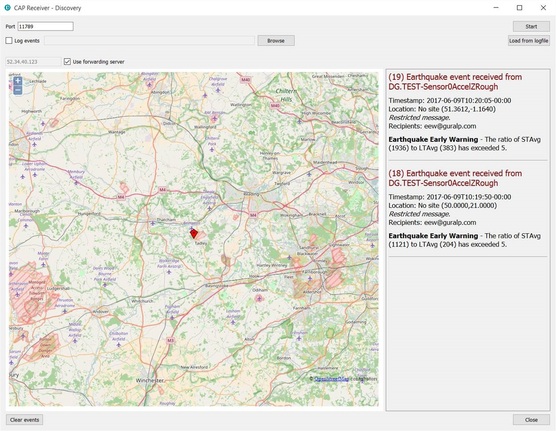
When an event is detected and a CAP message is received, the location of the Fortimus that generated the trigger is identified by a pointer displayed on the map. The events and the information contained in the CAP message are displayed at the right-hand side of the window. This includes the SEED identifiers, network, station, channel and location, along with the time, the recipients and the threshold value which was exceeded.
If the EEW parameters are enabled in a particular source, after the first CAP message containing the event information, three other messages with the PGA/PGV/PGD details are sent, one for each component.
Click on the 
7.17.5 Seismic Event Table
The Fortimus can generate a “Seismic Event Table”. This is list of events detected by the STA/LTA or threshold trigger enabled on taps. It contains information about the time when the event occurred, its duration, the channel that generated the trigger and the peak magnitude of the event. The seismic data before, during and after the event are saved in miniSEED format and can be downloaded using links in the table.
The table is located at the bottom of the “Trigger” tab in the Fortimus web page.

The Fortimus allows the download of event data in miniSEED format in a time range that is user selectable. The user can select how many seconds before and after the event detection to include in the miniSEED file.

Note: Use the
The event table shows which of the components has caused the trigger and the user can chose to either download data related to that single component by deselecting the option “Download Z, N, E Triplet” or download data for all three components by leaving the option enabled.

The last column of the table contains links to downloaded and saved miniSEED files related to each event.

Note: The links produce downloadable miniSEED files if and only if the requested data is available in the microSD card. This depends on last flushing time and selected post event time.
7.18 Using a registry
Discovery can maintain a list of all Minimus and Fortimus units in a local or cloud-based registry, simplifying management of medium to large networks and removing the need for static IP addresses at telemetered stations. Registered digitisers appear in the selection list in the main screen, regardless of whether they are on the local network or not.
Administrators can create their own registry servers by installing a simple program on a server. The server itself must have a static IP address and be accessible to all connected Minimus/Fortimus units, as well as the PCs running discovery. Registry servers programs are currently available for Linux and Windows. Please contact Güralp technical support for details.
For administrators not wishing to install their own registry, Güralp provide a shared registry server in the cloud at 52.34.40.123 which customers are welcome to use.
Registered digitisers must be assigned to groups, each of which has a Group Identifier. Instances of Discovery must also be configured with a Group ID and can only display registered digitisers from the matching group. This allows partitioning of large networks into smaller administrative domains. It also makes possible the simultaneous use of the Güralp shared registry server by multiple organisations.
To use a registry:
Choose whether to use the Güralp shared registry or to deploy your own. If deploying your own, install the software on your chosen server and note its public IP address.
Choose one or more Group IDs for your digitisers
Set the Registry server address and Group ID in each Minimus/Fortimus
Set the Registry server address and Group ID in each instance of Discovery.
7.18.1 Configuring a Fortimus for use with a registry
The address of the registry server and the chosen Group ID must be set individually for each participating Fortimus.
To do this, first connect the Fortimus to the same network as a PC running Discovery and click the 
 ) on the digitiser’s entry and select “View Web Page” from the context menu:

In the resulting web page, select the “Network” tab. The Registry parameters can be found near the bottom of the resulting screen:

These are:
Registry Update: the frequency at which the registry is updated with details of this digitiser can be specified here, using the drop-down menu;
Group ID: the chosen Group Identifier should be entered here;
Registry Address: the I.P. address of the registry should be entered here. To use the Güralp shared cloud server, enter 52.34.40.123.
Once you have set the correct values, the digitiser must be rebooted before they will take effect. To do this, click the 
7.18.2 Configuring Discovery for use with a registry
To specify a registry server for an instance of discovery, type its address into the field at the bottom left of the main screen:

To set the Group ID in Discovery:
Select "Settings " from the “File” menu:
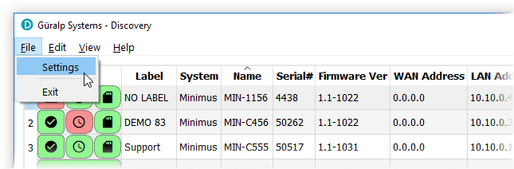
Type the chosen Group ID in the “Cloud registry group identifier” field and click

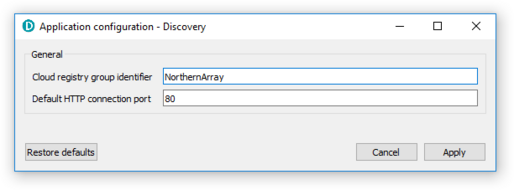


Return to the main windows and test the configuration by clicking the 
7.18.3 Registry mode: using WAN or LAN addresses
When Discovery displays a list of devices found from a local scan, all access to those systems is initiated via the LAN address. When displaying a list of registered devices, you have the option of using either the LAN address or the WAN address. This can be useful when the WAN address has been configured but is not yet available or when a registered device is installed remotely and not available on the LAN. The feature is controlled by exactly where you right-click in the list of devices.
If you right-click anywhere other than in the LAN address column, the WAN address is used and the behaviour is otherwise exactly as previously documented. To access the digitiser via its LAN address, right-click in the LAN address column, as shown below:

When you click on the LAN address of an entry, the context menu changes:

Entries for firmware updates, system and GDI configuration and web page access all now use the LAN address rather than the WAN address.
In addition, all options on the Live View sub-menu use the LAN address:

and the calibration page editor is also invoked using the LAN address:

Note: For these techniques to work, the digitiser and PC must be connected to the same LAN.
7.19 Updating Fortimus firmware
The firmware of the Fortimus is upgradeable. New releases appear regularly – mostly to add new features but, occasionally, to fix problems. Güralp recommends that the Fortimus is regularly checked for availability of firmware updates and, when convenient, these updates should be installed.
The procedure below guarantees a straightforward upgrade and prevents any data loss or misconfiguration.
Note: The latest version of Discovery software must be used to perform the firmware update of any Fortimus digitiser. See Section 13.5 for more details.
Unplug the external microSD card from your Fortimus.
Plug the external microSD card into your PC.
Copy all files from the external microSD card into your PC.
Unplug the external microSD card from your PC.
Plug the external microSD card back into your Fortimus.
Once this is complete, to upgrade the Fortimus:
Run Discovery.
Right-click on the Fortimus in Discovery main window and select “Firmware Update”.
In the “Firmware Update” tab, select “Güralp server – stable (online version: 2.0-****)” to obtain the new firmware from the Internet via a local Ethernet connection. Click

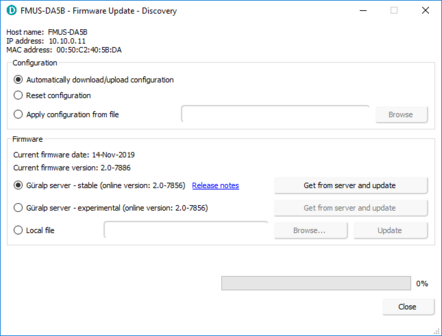


Caution: If updating from any release of v1.2 to v2.0, select the option “Güralp server – version 2.0-**** (online)” only. Do not use “Local file” option unless agreed case-by-case with support@guralp.com.

If updating from any release of below v1.2, contact support@guralp.com before proceeding.
Discovery will ask you if you want to save the Firmware binary file for future use – click


Discovery may ask to overwrite a temporary file on your PC – click
Discovery will confirm through another dialogue box that the file download is complete. Click
At the end of the uploading process, the dialogue box will ask to restart the Fortimus. Click


A dialogue box will ask you if you want to upload the previous configuration. Click
When the configuration is uploaded, the Fortimus needs to be restarted again. Confirm with
The Fortimus will re-boot and, during this process, the displays will show a white screen with the Güralp logo in the middle and a progress-bar at the bottom.
Go to the “Storage” of the Fortimus web page and Quick-format the microSD cards of your Fortimus (for details, see Section 7.10.2.1).
Check that all indicators are green (i.e. nothing in red nor in yellow) in Discovery.
Go to the “Status” tab of the Fortimus web page.
Check that your Fortimus firmware version is as expected.
Check that nothing red or yellow shows up in the “Status” tab of the Fortimus web page.


7.20 Import / Export an existing configuration
Updating the Fortimus’ firmware can, occasionally, cause loss of configuration. We recommend that you export and save the current configuration before proceeding with an upgrade. This operation can be done through Discovery by right-clicking on the digitiser in the list and selecting “System Configuration” from the context menu:

Select "Use configuration from one of the devices". If more than one device is available, select the one from which the configuration should be downloaded. Click the 

After the firmware update is successfully completed, the previous configuration can be imported, if required, by following the instructions below.
Right-click on the digitiser’s entry in the Discovery list and select "System Configuration" from the context menu. Select the "Use configuration from file" option.

Select the configuration file from where it was saved in the File Explorer and confirm. Use the check-boxes to select the devices to which the configuration should be uploaded and click on the 
Wait until the process finishes. To apply the new configuration, the unit has to be rebooted: the 
Note: The configuration export and upload doesn’t preserve the settings related to the applied transforms.
7.21 Control Centre
Several actions can be taken from within Discovery to control your Fortimus digital accelerometer.
These operations can be performed by right-clicking on the digitiser’s entry in the list and select “Control Centre” from the context menu. The meanings of the icons are given in the table below:
Icon | Function |
| This tab provides information about the general state of the instrument, its serial number and I.P. address, its up-time (time since last boot) and GNSS status. |
| This button launches a console that allows interactions with the command line of the Fortimus. The list of available commands and their respective descriptions can be displayed by entering the command “help”. This should generally only be done on the advice of the Güralp technical support team. |
| This button is equivalent to the “View Web Page” entry in the context (right-click) menu of the Fortimus in the Discovery main window. |
| This button is equivalent to the “Show on Map” entry in the context (right-click) menu of the Fortimus in the Discovery main window. |
| This button is equivalent to the “Live View” entry in the context (right-click) menu of the Fortimus in the Discovery main window. |
| This tab allows manual centring of the Fortimus accelerometer. |


