
Chapter 5. The Main Window
When you start Scream!, you will be shown an empty Main Window:
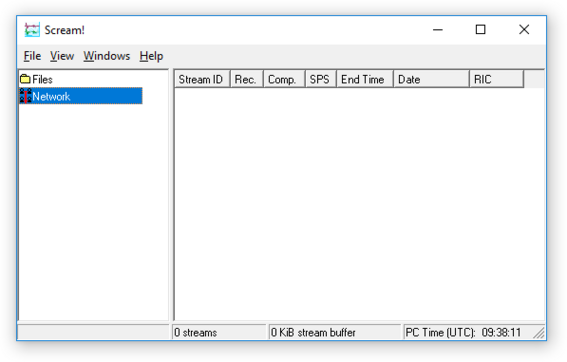
This will become populated once you start adding data sources.
The Main Window window is the controlling window for the instance. (It is possible to run many simultaneous instances provided that they have different initialisation files - see section 16.1 for more details.) Scream!'s other windows can be opened and closed as you wish but, if you close the main window, the instance will exit.
Note: See section 15.1 for a list of keyboard shortcuts that you can use in the main window.
5.1 The stream buffer
Scream! works by recording incoming streams into a fixed area of memory, called the stream buffer. All of Scream!'s operations work with the data in this buffer.
(When viewing recorded files, the file itself is used instead of the stream buffer, which allows much larger data-sets to be handled. View mode has a memory overhead of around 10% of the size of the recorded file(s): this is used to store summary information.)
When you start Scream! for the first time, this buffer is empty. You can add data to it either by receiving it from local serial ports, connecting to Scream! network servers, or replaying GCF files.
Once the stream buffer is full, Scream! will start discarding the oldest data. If you have not told Scream! to record the incoming streams (see Chapter 11), then you will not be able to retrieve these discarded data.
Note: You can change the size of the stream buffer from the Display pane of the Setup window (see section 6.4.1).
If you have enabled GCF recording, Scream! keeps track of the files which contain data in the stream buffer, and saves this information in a .lst file in a folder .display.lst under the current recording directory (set using the Base Directory item on the Files tab of the set-up dialogue). When Scream! is restarted, it reads this file and tries to rebuild the stream buffer as it was when it was shut down. Otherwise, the buffer starts off empty as before.
5.2 The source tree
The tree in the left panel of the Main Window shows all the data sources currently connected to Scream!, whether local instruments, networked instruments, or files being replayed.
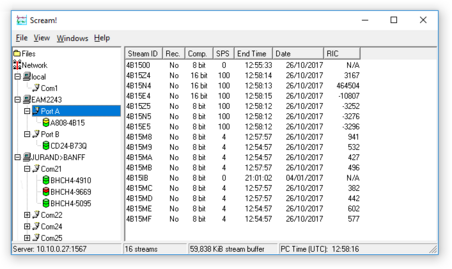
Scream!'s source tree has two main parts: 

Beneath Network is a list of all the network servers Scream! is receiving data from, plus the entry Local for your computer's own serial ports, if in use.
The next layer contains the serial ports themselves. These icons are provided to help you identify the instruments, as well as providing direct terminal access.
As an example, the screen shot above shows Scream! running on a computer which is not directly attached to any instruments, although it has a serial port labelled Com1. It receives data from two network sources: An EAM, EAM2243, and a PC, BANFF (which is sending its data via a system called JURAND).
The EAM has two serial ports, Port A and Port B, and BANFF has four serial ports, Com21, Com22, Com24 and Com25. Port A on the EAM is attached to instrument A808-4B15, Port B on the EAM is attached to instrument CD24-B73Q and Com21 on BANFF is attached to three instruments, BHCH3-4910, BHCH4-9669 and BHCH4-5095.
The EAM2243 server icon and the JURAND>BANFF server icon have been “unrolled” to reveal the serial port icons. You can “roll up” icons and save space by clicking on the 


You can tell Scream! to ignore a particular instrument by right-clicking on its icon and selecting Ignore. When you do this, Scream! will discard any blocks it receives from the instrument. They will not appear in the stream buffer or be recorded to disk. Select Ignore again to stop ignoring the instrument. This setting is not remembered through stop/start of Scream.
Note: See section 15.1.2 for a list of keyboard shortcuts that you can use in the source tree.
5.2.1 Icons
Instrument icons change colour to provide you with a quick overview of the instrument's timing (top half) and mass position (bottom half) status:
If both halves of the instrument icon are grey 
If the top half is green 

If the top half is yellow 
If the top half is red 
If the bottom half is red 
If the instrument appears as a green box 
5.3 The stream list
If Network is selected in the source tree, the right-hand panel will list all the data streams which Scream! receives (other than those which it is ignoring). If an entry in the source tree is selected, the stream list will only show the streams beneath that entry—selecting a serial port will only show streams from instruments connected to that port, and so on.
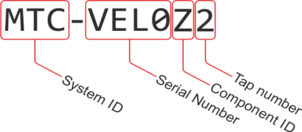
The first column contains the Stream ID. The other columns in the table provide useful information about each stream. A System ID and a Stream ID, together, uniquely identify a data stream. The Stream ID is encoded as described below.
Note: See section 15.1.3 for a list of keyboard shortcuts that you can use in the stream list.
5.3.1 Stream IDs
A Stream ID is a unique name for the data stream, being a combination of six letters A – Z and numbers 0 – 9. The first four characters of this name identify the digitiser, and the last two characters identify the individual stream.
The first four characters are set by default to the serial number of the digitiser; you can change this on the System ID pane of the Configuration Setup window (see section 9.1) or from the digitiser's console.
The last two characters tell you the type, component, and output tap of the stream. The possible values for streams from CD24 and DM24 digitisers are given in the table below. The Affinity and Minimus digitisers add many more possible IDs: please see the relevant digitiser manual or the Support→FAQs section of our web site for further details.
Suffix | Data source | |
Main outputs (See note 1, below) | ||
Z0 | SENSOR A, Vertical channel, 1st (fastest) tap | |
Z2 | SENSOR A, Vertical channel, 2nd tap | |
Z4 | SENSOR A, Vertical channel, 3rd tap | |
Z6 | SENSOR A, Vertical channel, 4th (slowest) tap | |
N0, N2, N4, N6 | SENSOR A, North/South channel, 1st to 4th tap, respectively | |
E0, E2, E4, E6 | SENSOR A, East/West channel, 1st to 4th tap, respectively | |
Mass positions | ||
M8 | SENSOR A, Vertical channel, mass position output | |
M9 | SENSOR A, North/South channel, mass position output | |
MA | SENSOR A, East/West channel, mass position output | |
Metadata and text streams | ||
00 | The status stream | |
IB | The contents of the information blocks (only sent at boot-up or on request). See section 5.7 for details. | |
BP | Byte-pipe data (from text-to-GCF converters) | |
01 | Unified status (structured state-of-health information) | |
CD | Structured status for CD1.1 (obsolete) | |
Second instrument, main outputs (See note 2, below) | ||
Z1, Z3, Z5, Z7 | SENSOR B, Vertical channel, 1st to 4th tap, respectively | |
N1, N3, N5, N7 | SENSOR B, North/South channel, 1st to 4th tap, respectively | |
E1, E3, E5, E7 | SENSOR B, East/West channel, 1st to 4th tap, respectively | |
Auxiliary inputs and calibration returns | ||
X0 | SENSOR A, Auxiliary input, 1st (fastest) tap | |
X2 | SENSOR A, Auxiliary input, main output, 2nd tap | |
X4 | SENSOR A, Auxiliary input, main output, 3rd tap | |
X6 | SENSOR A, Auxiliary input, main output, 4th (slowest) tap | |
C0 | SENSOR A, Calibration signal return, 1st (fastest) tap | |
C2 | SENSOR A, Calibration signal return, 2nd tap | |
C4 | SENSOR A, Calibration signal return, 3rd tap | |
C6 | SENSOR A, Calibration signal return, 4th (slowest) tap | |
MB | SENSOR A, multiplexed input B (used as calibration signal return on early digitisers) | |
MC | SENSOR A, multiplexed input C | |
MD | SENSOR A, multiplexed input D | |
ME | SENSOR A, multiplexed input E (connected to an internal thermometer on some models) | |
MF | SENSOR A, multiplexed input F | |
Triggered data | ||
ZG | SENSOR A, Vertical channel, triggered output, 1st (fastest) tap | |
ZI | SENSOR A, Vertical channel, triggered output, 2nd tap | |
ZK | SENSOR A, Vertical channel, triggered output, 3rd tap | |
ZM | SENSOR A, Vertical channel, triggered output, 4th (slowest) tap | |
NG, NI, NK, NM | SENSOR A, North/South channel, triggered output, 1st to 4th tap, respectively | |
EG, EI, EK, EM | SENSOR A, East/West channel, triggered output, 1st to 4th tap, respectively | |
ZH, ZJ, ZL, ZN | SENSOR B, Vertical channel, triggered output, 1st to 4th tap, respectively | |
NH, NJ, NL, NN | SENSOR B, North/South channel, triggered output, 1st to 4th tap, respectively | |
EH, EJ, EL, EN | SENSOR B, East/West channel, triggered output, 1st to 4th tap, respectively | |
XH, XJ, XL, XN | Auxiliary channel, triggered output, 1st to 4th tap, respectively | |
Strong motion and Causal-filtered (low-latency) data (See note 3, below) | ||
ZO, NO, EO | Windowed minimum for Vertical, North/South and East/West, respectively | |
2O | Windowed minimum for two-dimensional, horizontal resultant | |
3O | Windowed minimum for three-dimensional (3D) resultant | |
ZP, NP, EP, 2P, 3P | Windowed PGA for Vertical, North/South, East/West, horizontal resultant and 3D resultant, respectively | |
ZQ, NQ, EQ, 2Q, 3Q | Windowed maximum for Vertical, North/South, East/West, horizontal resultant and 3D resultant, respectively | |
ZR, NR, ER, 2R, 3R | Windowed RMS for Vertical, North/South, East/West, horizontal resultant and 3D resultant, respectively | |
ZS, NS, ES, 2S, 3S | Windowed spectral intensity for Vertical, North/South, East/West, horizontal resultant and 3D resultant, respectively | |
ZT, NT, ET, 2T, 3T | Windowed average for Vertical, North/South, East/West, horizontal resultant and 3D resultant, respectively | |
ZC, NC, EC | On an S6 digitiser, SENSOR A, Causal-filtered (low-latency) data for Vertical, North/South and East/West, respectively | |
ZD, ND, ED | On an S6 digitiser, SENSOR B, Causal-filtered (low-latency) data for Vertical, North/South and East/West, respectively (See note 2, below) | |
ZE, NE, EE | On an S3 digitiser, Causal-filtered (low-latency) data for Vertical, North/South and East/West, respectively | |
Notes
The letters Z, N and E (which identify the three main inputs and are used throughout this table) can be replaced by any three consecutive letters of your choice: see section 9.2 for details.
Digitisers with a SENSOR B input can either use the stream suffices in this section (the default) or be programmed with a second serial number for the second instrument, in which case they will use the same suffices as the SENSOR A instrument. You can programme a second serial number
using Scream (see section 9.1);
using an EAM or NAM (see section 8.1.1.1 of the EAM manual); or
from the command line of the digitiser (see SERIAL2 in section 3 of the DM24 manual).
Strong motion data and low-latency, causal-filtered streams are described in section 8.1.1.4 of the EAM manual.
Scream! can replace these designations with more helpful names if you wish: see section 6.4.2.
5.3.2 Other columns
The other columns of the Stream List are:
Rec. : Whether Scream! is currently recording the data stream to the computer's on-board hard disk (not the digitiser's memory). If another device on your network is recording the data stream independently of Scream!, the entry in this column might still be No. If this entry shows ERR, then there has been an error whilst writing data for this stream. Investigate the cause, then re-enable recording to clear the error. By default, an automatic retry will occur every 30 seconds.
A ‘*’ symbol might appear when recording is enabled. This indicates that some data has not been written – recording has been deferred because of a gap in the stream buffer contents. See Chapter 11 for more information.
Right-clicking on an entry in this column brings up a context menu which allows you to stop or start recording the selected stream. The selection is stored in the scream.rec file (see section 16.3) so that, if scream is subsequently set to automatically record all streams (see section 11.1.1), the original, manual selection can be restored if the automatic option is later deselected.
Comp. : The compression factor of the data in the stream, expressed as the number of bits occupied by each record (8, 16 or 32 bits). This can vary block-by-block.
SPS : The sampling rate of the data stream, in samples per second. Status streams, ending in 00, do not constantly output data and have an SPS of 0. By default, the stream list is sorted in order of sample rate, with the status streams at the bottom.
End time and Date : the date and time of the most recent data, as measured by the data's own time-stamps. These are not necessarily the latest to arrive.
RIC : The ‘Reverse Integrating Constant’. In effect this is the value of the last sample received. This is most useful for reading mass positions or other environmental streams. Status streams have a RIC of N/A.
If a stream is currently recording, on Windows the option “Explore Recording Folder” will open a Windows Explorer window at the folder where the data are currently recorded. This is useful to quickly browse to the recorded files.
5.3.3 Sorting options
Sorting options are available from the View → Sort By menu:
Alphabetical : Strict alphabetical order, 0 – 9 then A(a) – Z(z).
Component : Vertical components (ending Zx), followed by Nx and Ex components, then Mux channels Mx. Within a component type, sort by the first four characters of the Stream ID.
Instrument : Sort by the first four characters of the Stream ID. Within an instrument, sort by tap, then by component.
Sample Rate : Sort by sample rate, highest to lowest. Within a sample rate, sort as Instrument.
Tap : Sort by tap (the last character of the Stream ID). Within a tap, sort by instrument, then by component.
Select the Reversed option to reverse any of these sort orders.
You can also sort the list by Stream ID or SPS by clicking on the relevant heading; click again to reverse the sort order.
5.4 The status bar
At the bottom of Scream!'s Main Window is a status bar containing summary information about Scream!'s state:
The server address from where the data for the currently selected instrument is being received;
If no streams are selected, the number of different data streams currently accessible from the window, including those that have been “rolled up”; If any stream selection is in force (including a selected digitiser or port), the total number of streams selected;
The amount of memory currently being used by Scream!'s stream buffer. You can change the maximum size of the stream buffer from the Setup window (see section 6.4.1).
Note: If this number approaches the capacity of your computer, the computer may become slow and unresponsive.
The current time after your time-zone is removed, according to the local computer (not the timestamps of incoming data).
To disable or re-enable the status bar, deselect View → Status Bar on the menu.
5.5 Viewing streams
Double-click on one of the streams to open a window for viewing the data, or right-click on it and select View…. Alternatively, make a selection of streams from the list and then either double-click on the selection or key 
To select an adjacent range of streams, left-click (


To select a non-adjacent set of streams, left-click (


The selected data streams are opened in a WaveView window:
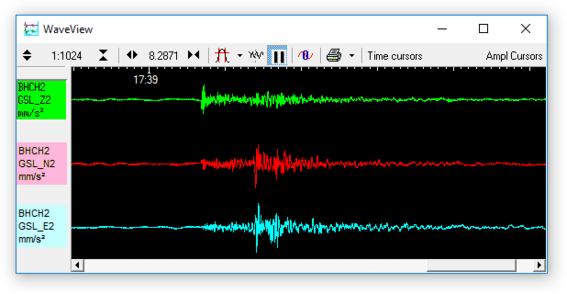
This window allows you to see real-time data coming in. You can also pause the window and examine any features held in the stream buffer. For full information on the features provided by WaveView windows, see Chapter 6.
Status streams (ending 00) consist of plain text. Double-clicking on a status stream produces the Status window:
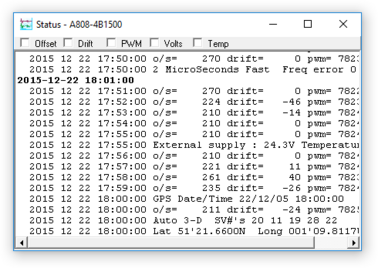
The first blocks transmitted by a digitizer after power-up will give the boot message from the digitiser, including its software revision and the data streams selected for downloading and triggering. Later blocks give information on visible GNSS satellites, the location of the GNSS antenna and time synchronization status. Also displayed are the baud rates currently used for each channel and for the data link.
For more information on status streams and GNSS, see section 8.2.
If you View a selection which includes both status and data streams, the status streams will be collected together and displayed in a tabbed Status window, whilst the data streams will appear in a single WaveView window.
5.6 Connecting to instruments
There are two basic user interface types for the control and configuration of Güralp digitisers:
Built into Scream, for products based on the DM24 and CD24 modules,
The web interface of the device itself, for network-connected products containing EAM, NAM, Affinity, Minimus etc modules.
Some products contain both types of module (e.g. DM24SxEAM), where either interface can be used. However, the interfaces are not universally interchangeable, so the operator should choose to use one or the other, but not to mix both.
This section mainly discusses the interface for the above-mentioned type 1 modules. For type 2 – right-click on the computer icon in the source tree and select Open Web Browser. Under Windows, this will open a web page in your default browser, referencing the sending network address as a URL. Under Linux, the command firefox is invoked with the URL as an argument. See the product-specific documentation for more information on it’s web interface.
Digitiser configuration (and other common operations) for DM24 and CD24 modules can be performed from Scream! by right-clicking on the digitiser in the source tree and selecting Configure… or Control… See Chapter 9 and Chapter 10 for more information.
Scream! also allows you to access the serial terminal of a connected DM24 or CD24 digitiser in order to issue commands directly. To do this, right-click on it and select Terminal…. See section 8.1 for more information about Scream!'s built-in terminal emulator.
An instrument may connected to Scream! through a series of other units (NAMs, EAMs etc). Scream! will negotiate with each unit in turn to reach the instrument you are interested in. However, the process may take a little time.
Right-clicking on a digitiser and selecting Triggers… brings up a window describing all the digitiser triggers that have been detected. This window can also be reached from the Summary window: see section 8.3 for more information.
5.7 Calibration data
Scream! can display data streams from displacement, velocity, and acceleration sensors in physical units. To be able to do this, it needs to know the calibration information provided with the sensor and digitiser.
Newer Güralp digitisers transmit calibration information in an information block (or InfoBlock) when they reboot. When Scream! receives an information block that it understands, it automatically extracts this information and remembers it.
You can also enter and edit calibration information manually. Right-click on the digitiser's icon and select Calvals…. A window will open with a text entry box. This window lets you edit Scream!'s calibration values file.
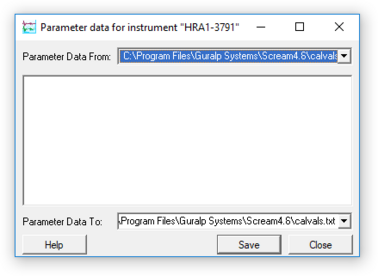
Fill in the text box with calibration information for your digitiser and the instrument connected to it, in the format described below.
To set the serial number of the instrument, include the line
Serial-Nos=serial-number
Scream! cannot tell what instrument is connected to the digitiser. This line is provided to help you remember which set of calibration values you have used, and to provide a title for calibration graphs. If you attach a different instrument to the same digitiser, you will need to enter new calibration values to reflect the new instrument.
To set the sensitivity of the digitiser, include the line
VPC=Z-sensitivity,N-sensitivity,E-sensitivity
VPC stands for voltage per count, measured in units of μV/count. This is sometimes given as μV/Bit on the digitiser calibration sheet.
To set the sensitivity of the calibration channel, include the line
CALVPC=sensitivity
as for the other digitiser channels.
To set the value of the calibration resistor, include the line
CALRES=resistance
Güralp Systems seismometers (velocimeters) digitisers normally use a 51 kΩ resistor (CALRES=51000). For accelerometers, you should enter CALRES=1 here.
To set the sensor type, include the line
TYPE=model-number
e.g. 3T, 5T etc..
To set the response of the sensor, include the line
RESPONSE=response-type unit
Some of the values you can use are given in the table below. If none of these match the response of your instrument, please contact support for advice.
Sensor | Sensor type code | Units |
5T or 5TD, DC – 100 Hz response | CMG-5_100HZ | A |
40T-1 or 6T-1, 1 s – 100 Hz response | CMG-40_1S_100HZ | V |
40T-1 or 6T-1, 2 s – 100 Hz response | CMG-40_2S_100HZ | V |
40T-1 or 6T-1, 10 s – 100 Hz response | CMG-40_10S_100HZ | V |
40T, 20 s – 50 Hz response | CMG-40_20S_50HZ | V |
40T, 30 s – 50 Hz response | CMG-40_30S_50HZ | V |
3T or 3ESP, 30 s – 50 Hz response | CMG-3_30S_50HZ | V |
40T, 60 s – 50 Hz response | CMG-40_60S_50HZ | V |
3T or 3ESP, 60 s – 50 Hz response | CMG-3_60S_50HZ | V |
3T or 3ESP, 100 s – 50 Hz response | CMG-3_100S_50HZ | V |
3T or 3ESP, 120 s – 50 Hz response | CMG-3_120S_50HZ | V |
3T, 360 s – 50 Hz response | CMG-3_360S_50HZ | V |
3TB or 3V / 3ESP borehole, | CMG-3B_30S_50HZ | V |
3TB or 3V / 3ESP borehole, | CMG-3B_100S_50HZ | V |
3TB or 3V / 3ESP borehole, | CMG-3B_120S_50HZ | V |
3TB or 3V / 3ESP borehole, | CMG-3B_360S_50HZ | V |
3TB or 3V / 3ESP borehole, | CMG-3B_360S_100HZ | V |
To set the sensitivity (or gain) of the sensor components, include the line
G=Z-sensitivity,N/S-sensitivity,E/W-sensitivity
These values are given on the sensor calibration sheet. For velocity sensors, they are given in units of V / ms-1. The gain of an accelerometer is expressed in V / ms-2. Because Güralp sensors and digitisers use differential inputs and outputs, the sensitivity is quoted as 2 × (single-ended sensitivity) on the calibration sheet.
To set the coil constants of the sensor components, include the line
COILCONST=Z-constant,N/S-constant,E/W-constant
These values are given on the sensor calibration sheet.
To set the local acceleration due to gravity, include the line
GRAVITY=acceleration
You should give this value in ms-2, if you know it. If you miss out this line, Scream! will use a standard average g value of 9.80665 ms-2.
Some shorthand descriptions are also accepted, e.g. 120s velocity, or 100Hz acceleration but this is not a free-format, parsed field.
When you have filled in all the values, click 
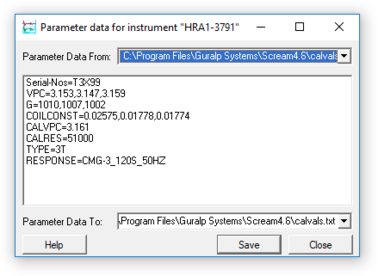
Any WaveView windows that are open will change to show streams in physical units. New WaveView windows will also use these units where possible.
Note: If an instance of Scream is receiving data forwarded by another copy of Scream, it will request an InfoBlock from the upstream instance if it receives data from a source for which it has no calibration information.
Note: See the note in section 16.2 for information about possible alternative locations of the calvals.txt file. If multiple calvals.txt files are found, they will appear in the Parameter Data From and Parameter Data To drop-down menus. The displayed values are taken from the file identified in Parameter Data From and the Save button writes the (possibly modified) values to the file identified in Parameter Data To.
5.7.1 Example
The calibration information for a 3T weak-motion velocity sensor might look like the following:
Serial-Nos=T3X99
VPC=3.153, 3.147, 3.159
G=1010, 1007, 1002
COILCONST=0.02575, 0.01778, 0.01774
CALVPC=3.161
CALRES=51000
TYPE=CMG-3T
RESPONSE=CMG-3_30S_50HZ V
GRAVITY=9.80122
Note: 5TC accelerometers use 1 Ω calibration resistors, and their coil constant is set to 1.
For information on the file, calvals.txt, which stores these values, see section 16.2.
5.7.2 Six-channel digitisers
When working with six-channel digitisers, you have a choice:
You can keep a single serial number for both instruments. In this case, the VPC, G and COILCONST lines need to have six comma-separated values each and the CALRES and RESPONSE entries also need double-values; or
You can configure a second serial number into the digitiser for use with SENSOR B. In this case two separate sets of information are required; one for each serial number.
Other than the stream names, the effects of both methods are identical so you should decide based on whether having two serial numbers appears natural in your application or not.
You can programme a second serial number:
using Scream (see section 9.1);
using an EAM or NAM (see section 8.1.1.1 of the EAM manual); or
from the command line of the digitiser (see SERIAL2 in section 3 of the DM24 manual).
5.8 Other features
The main menu also provides some miscellaneous facilities:
Choose File → Save Program State to save Scream!'s configuration file immediately. This file is read whenever you start Scream!, and any changes are written back whenever you close it. Under Microsoft Windows, the configuration file appears as scream.ini in the c:\scream directory; under Linux, it is saved in $HOME if this variable is set, otherwise the same directory as the Scream! program file. You can change the name and location of the configuration file with a command line option (see section 16.1).
Choose File → Application Caption… to change the title of Scream!'s Main Window. This is useful if you have several copies of Scream! running on the same computer (e.g. to run multiple network services).
Choose View → Stay On Top to keep Scream!'s Main Window on top of all other Scream! windows at all times. Other applications may still cover Scream!'s Main Window.